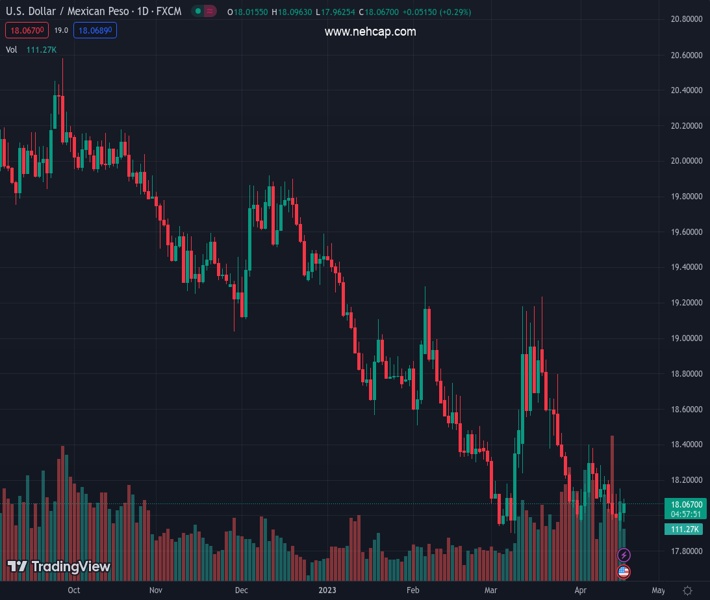
#USDMXN @ 18.0726 rises amid speculation that Banxico’s will pause while the Fed tightens conditions. (Pivot Orderbook analysis)
…
This is a premium post.
[s2If !current_user_can(access_s2member_level4)]Please register for PREMIUM VERSION HERE to read full post below containing analysis. In case of any error or you think you are not able to read the full post below, please email us at support#nehcap.com [lwa][/s2If] [s2If current_user_can(access_s2member_level4)]
- USD/MXN rises amid speculation that Banxico’s will pause while the Fed tightens conditions.
- St. Louis Fed President Bullard advocates for continued rate hikes in the US; see rates between 5.50% – 5.75%.
- Atlanta Fed President Bostic expects one more rate hike and a pause.
The pair currently trades last at 18.0726.
The previous day high was 18.1542 while the previous day low was 17.9329. The daily 38.2% Fib levels comes at 18.0696, expected to provide support. Similarly, the daily 61.8% fib level is at 18.0174, expected to provide support.
The Mexican Peso (MXN) continues to weaken for the second consecutive day, despite overall American Dollar (USD) weakness across the board. Outflows from the emerging market currency increased, spurred by an almost certain case for a 25 bps rate hike by the Federal Reserve (Fed) at the May meeting. At the time of writing, the USD/MXN is exchanging hands at 18.0719 after hitting a low of 17.9625.
US equities fluctuate with market participants assessing Q1 earnings. Federal Reserve officials continued reinforcing their hawkish stance, though they failed to bolster the greenback. The US Dollar Index (DXY), which tracks the performance of six currencies vs. the buck, drops 0.31%, at 101.770.
The reasons behind the USD/MXN rise could be attributed to ebbs and flows. Estimates that the Bank of Mexico (Banxico) is about to end its tightening campaign weighed on the Mexican Peso. Additionally, a deceleration in inflation increased the odds for a Banxico’s pause.
On the US front, the St. Louis Fed President James Bullard commented that the Fed should continue to raise rates as the latest tranche of inflation data proved to be stickier than estimated. “Wall Street’s very engaged in the idea there’s going to be a recession in six months or something, but that isn’t really the way you would read an expansion like this,” Bullard said.
Bullard added that he feels rates need to go between 5.50% – 5.75%.
Data-wise, the US economic docket featured Building Permits and Housing Starts, which decreased by 0.80% MoM in March, after February’s 7.3% jump (downward revised from 9.8%). Building Permits dropped 8.8%, below estimates for a 1.45% gain, though February’s figures were upward revised to 15.8% from 13.8%.
In the meantime, Federal Reserve’s expectations for the May meeting lie at an 86.7% chance for a 25 bps hike, according to the CME FedWatch Tool.
Lately, the Atlanta Fed President Raphael Bostic said he favors one more rate hike and then a pause. Bostic commented that inflation would take some time to return to the Fed’s target and that his baseline does not foresee a recession.
From a technical analysis perspective, the USD/MXN is still downward biased. However, the recent leg-up could put up a test to the 20-day Exponential Moving Average (EMA) at 18.1772, which, once cleared, could exacerbate a rally, initially to the 50-day EMA at 18.3889. Break above, and the USD/MXN pair could rally toward the 100-day EMA at 18.7133. Conversely, if USD/MXN drops beneath 18.0000, that could open the door for a re-test of the YTD low at 17.8968.
Technical Levels: Supports and Resistances
USDMXN currently trading at 18.0717 at the time of writing. Pair opened at 18.0216 and is trading with a change of 0.28 % .
| Overview | Overview.1 | |
|---|---|---|
| 0 | Today last price | 18.0717 |
| 1 | Today Daily Change | 0.0501 |
| 2 | Today Daily Change % | 0.2800 |
| 3 | Today daily open | 18.0216 |
The pair remains strongly bearish on the daily time frame. It trades below the 20 SMA @ 18.219, 50 SMA 18.3788, 100 SMA @ 18.8118 and 200 SMA @ 19.41.
| Trends | Trends.1 | |
|---|---|---|
| 0 | Daily SMA20 | 18.2190 |
| 1 | Daily SMA50 | 18.3788 |
| 2 | Daily SMA100 | 18.8118 |
| 3 | Daily SMA200 | 19.4100 |
The previous day high was 18.1542 while the previous day low was 17.9329. The daily 38.2% Fib levels comes at 18.0696, expected to provide support. Similarly, the daily 61.8% fib level is at 18.0174, expected to provide support.
Note the levels of interest below:
- Pivot support is noted at 17.9183, 17.8149, 17.697
- Pivot resistance is noted at 18.1395, 18.2575, 18.3608
| Levels | Levels.1 |
|---|---|
| Previous Daily High | 18.1542 |
| Previous Daily Low | 17.9329 |
| Previous Weekly High | 18.2844 |
| Previous Weekly Low | 17.9753 |
| Previous Monthly High | 19.2324 |
| Previous Monthly Low | 17.8977 |
| Daily Fibonacci 38.2% | 18.0696 |
| Daily Fibonacci 61.8% | 18.0174 |
| Daily Pivot Point S1 | 17.9183 |
| Daily Pivot Point S2 | 17.8149 |
| Daily Pivot Point S3 | 17.6970 |
| Daily Pivot Point R1 | 18.1395 |
| Daily Pivot Point R2 | 18.2575 |
| Daily Pivot Point R3 | 18.3608 |
[/s2If]
Join Our Telegram Group
")


