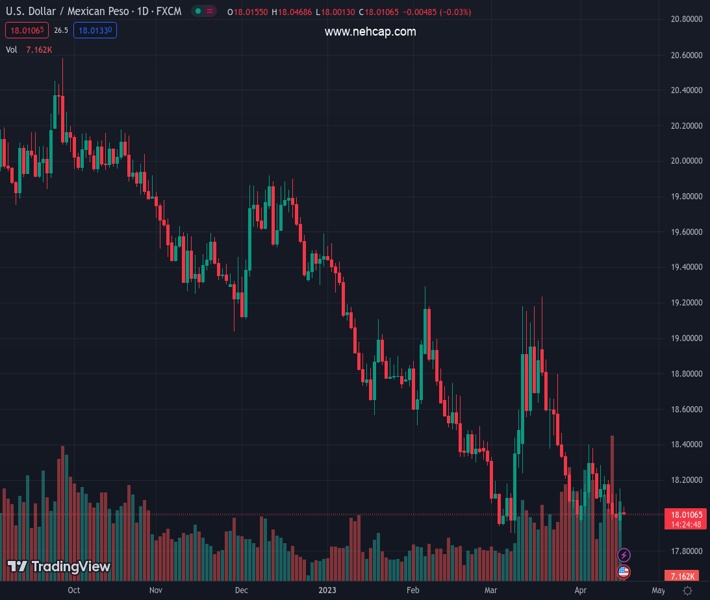
#USDMXN @ 18.0107 struggles for clear directions as it flirts with short-term key support., @nehcap view: Recovery expected (Pivot Orderbook analysis)
…
This is a premium post.
[s2If !current_user_can(access_s2member_level4)]Please register for PREMIUM VERSION HERE to read full post below containing analysis. In case of any error or you think you are not able to read the full post below, please email us at support#nehcap.com [lwa][/s2If] [s2If current_user_can(access_s2member_level4)]
- USD/MXN struggles for clear directions as it flirts with short-term key support.
- Multiple Doji candlesticks, sluggish oscillators suggest Mexican Peso buyers run out of steam.
- USD/MXN needs validation from 21-day EMA to convince short-term
The pair currently trades last at 18.0107.
The previous day high was 18.1542 while the previous day low was 17.9329. The daily 38.2% Fib levels comes at 18.0696, expected to provide resistance. Similarly, the daily 61.8% fib level is at 18.0174, expected to provide resistance.
USD/MXN appears indecisive around 18.00 amid early Tuesday in Europe, keeping the three-day trend of inaction.
That said, the Mexican Peso (MXN) pair has been lackluster and portrays Doji candlesticks since the last Friday. While doing the same, the quote also seesaws around a five-week-old ascending support line, close to 17.99 by the press time.
Apart from the Doji candlesticks that show traders’ indecision and challenge the USD/MXN pair’s downward trajectory from late March, the sluggish RSI (14) and MACD signals also tease the Mexican Peso sellers.
However, a daily closing beyond the 21-day Exponential Moving Average (EMA), close to 18.20 at the latest, becomes necessary for the USD/MXN buyers to convince intraday traders.
Following that, the monthly high of 18.40 and the 19.00 round figure will gain the market’s attention.
Should the USD/MXN bulls keep the reins past 19.00, tops marked during March and February, around 19.23 and 19.30 respectively, will be in the spotlight.
Alternatively, a daily closing below the aforementioned support line, close to 17.99, will be enough to challenge the multi-month low marked earlier in March, near 17.89.
If at all the USD/MXN remains bearish past 17.89, multiple lows marked in June 2017 around 17.80 and the year 2017 bottom surrounding 17.44 could please the bears afterward.
Trend: Recovery expected
Technical Levels: Supports and Resistances
USDMXN currently trading at 18.023 at the time of writing. Pair opened at 18.0216 and is trading with a change of 0.01% % .
| Overview | Overview.1 | |
|---|---|---|
| 0 | Today last price | 18.023 |
| 1 | Today Daily Change | 0.0014 |
| 2 | Today Daily Change % | 0.01% |
| 3 | Today daily open | 18.0216 |
The pair remains strongly bearish on the daily time frame. It trades below the 20 SMA @ 18.219, 50 SMA 18.3788, 100 SMA @ 18.8118 and 200 SMA @ 19.41.
| Trends | Trends.1 | |
|---|---|---|
| 0 | Daily SMA20 | 18.2190 |
| 1 | Daily SMA50 | 18.3788 |
| 2 | Daily SMA100 | 18.8118 |
| 3 | Daily SMA200 | 19.4100 |
The previous day high was 18.1542 while the previous day low was 17.9329. The daily 38.2% Fib levels comes at 18.0696, expected to provide resistance. Similarly, the daily 61.8% fib level is at 18.0174, expected to provide resistance.
Note the levels of interest below:
- Pivot support is noted at 17.9183, 17.8149, 17.697
- Pivot resistance is noted at 18.1395, 18.2575, 18.3608
| Levels | Levels.1 |
|---|---|
| Previous Daily High | 18.1542 |
| Previous Daily Low | 17.9329 |
| Previous Weekly High | 18.2844 |
| Previous Weekly Low | 17.9753 |
| Previous Monthly High | 19.2324 |
| Previous Monthly Low | 17.8977 |
| Daily Fibonacci 38.2% | 18.0696 |
| Daily Fibonacci 61.8% | 18.0174 |
| Daily Pivot Point S1 | 17.9183 |
| Daily Pivot Point S2 | 17.8149 |
| Daily Pivot Point S3 | 17.6970 |
| Daily Pivot Point R1 | 18.1395 |
| Daily Pivot Point R2 | 18.2575 |
| Daily Pivot Point R3 | 18.3608 |
[/s2If]
Join Our Telegram Group
")


