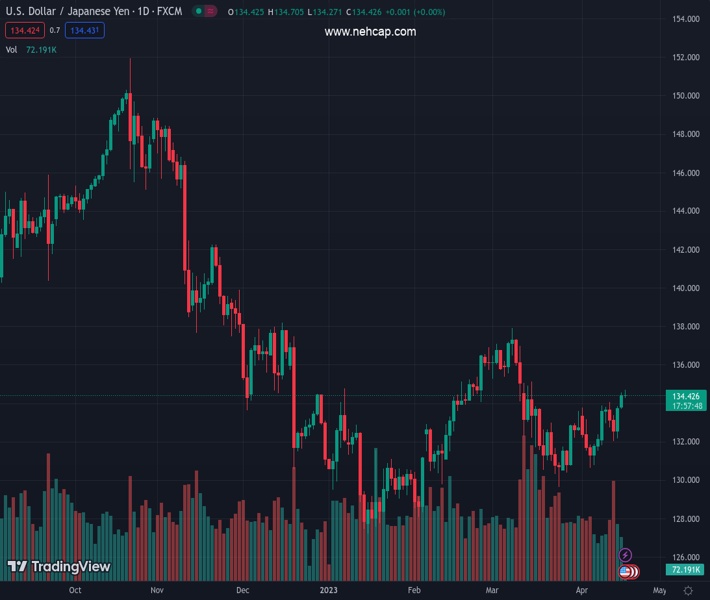
#USDJPY @ 134.522 prods two-day uptrend as it eases from multi-day high. (Pivot Orderbook analysis)
…
This is a premium post.
[s2If !current_user_can(access_s2member_level4)]Please register for PREMIUM VERSION HERE to read full post below containing analysis. In case of any error or you think you are not able to read the full post below, please email us at support#nehcap.com [lwa][/s2If] [s2If current_user_can(access_s2member_level4)]
- USD/JPY prods two-day uptrend as it eases from multi-day high.
- Fears that Japan’s fiscal policy, recent bond buying challenge BoJ’s ultra-loose monetary policy check Yen pair buyers.
- Hawkish Fed bets, upbeat US data favor yields, US Dollar despite latest pullback in prices.
- Second-tier US data, risk catalysts eyed for clear directions.
The pair currently trades last at 134.522.
The previous day high was 134.57 while the previous day low was 133.71. The daily 38.2% Fib levels comes at 134.24, expected to provide support. Similarly, the daily 61.8% fib level is at 134.04, expected to provide support.
USD/JPY bulls struggle to keep the reins during a three-day winning streak amid early Tuesday. While portraying the same, the Yen pair eases from an intraday high, as well as the highest levels since March 15, to 134.50 at the latest.
The latest chatters surrounding the Bank of Japan’s (BoJ) easy money policy seem to weigh on the Yen pair as the decision-makers try to defend the current policy amid challenges from bond buying and fiscal moves.
That said, new Bank of Japan (BoJ) Governor Kazuo Ueda said that BoJ bond purchases are not aimed at monetizing government debt while adding, “Interest rates are determined by various factors.”
Before BoJ’s Ueda, the newly appoint BoJ Deputy Governor Shinichi Uchida also tried to defend the current monetary policy as he said, “Fiscal constraints won’t undermine the ability to carry out monetary policy.”
Elsewhere, the market’s anxiety ahead of the key US PMIs and Japan inflation numbers, as well as due to mixed updates from China, also weighs on the USD/JPY price. While portraying the mood, S&P 500 Futures remain indecisive even as Wall Street closed with mild gains whereas Japan’s Nikkei 225 rises 0.67% intraday to 28,705 at the latest.
On the other hand, recently upbeat US data fuels the market’s bets on the 0.25% Fed rate hike in May, as well as cut the odds of a rate reduction from the US central bank sometime in late 2023. The same could be linked to the recently firmer US Treasury bond yields, before the latest retreat. That said, the US 10-year and two-year Treasury bond yields snap a three-day uptrend with mild losses around 3.60% and 4.18% by the press time.
Not only the data and the yields but Fed talks also favored the hawkish Fed bets and the USD/JPY buyers previously. That said, the NY Empire State Manufacturing Index jumped to 10.8 for April while snapping the four-month downtrend, as well as marking the highest level since July last year. Further, the US National Association of Home Builders (NAHB) housing market index also rose for the fourth consecutive month in April to 45, versus 44 expected and prior reading. Following the data, Richmond Fed President Thomas Barkin said on Monday that he wants to see more evidence of inflation settling back to target. The policymaker also added that he feels reassured by what he is seeing in the banking sector.
Moving on, USD/JPY traders may witness further volatility as the economic calendar gets active. Though, Fed bets and yields are the key to follow for clear directions.
USD/JPY pair’s successful trading above the 200-day Exponential Moving Average (EMA), around 133.70 by the press time, allows the Yen pair buyers to remain hopeful despite the recent struggle.
Technical Levels: Supports and Resistances
USDJPY currently trading at 134.51 at the time of writing. Pair opened at 134.46 and is trading with a change of 0.04% % .
| Overview | Overview.1 | |
|---|---|---|
| 0 | Today last price | 134.51 |
| 1 | Today Daily Change | 0.05 |
| 2 | Today Daily Change % | 0.04% |
| 3 | Today daily open | 134.46 |
The pair is trading above its 20 Daily moving average @ 132.35, above its 50 Daily moving average @ 133.51 , above its 100 Daily moving average @ 133.1 and below its 200 Daily moving average @ 137.14
| Trends | Trends.1 | |
|---|---|---|
| 0 | Daily SMA20 | 132.35 |
| 1 | Daily SMA50 | 133.51 |
| 2 | Daily SMA100 | 133.10 |
| 3 | Daily SMA200 | 137.14 |
The previous day high was 134.57 while the previous day low was 133.71. The daily 38.2% Fib levels comes at 134.24, expected to provide support. Similarly, the daily 61.8% fib level is at 134.04, expected to provide support.
Note the levels of interest below:
- Pivot support is noted at 133.92, 133.39, 133.06
- Pivot resistance is noted at 134.78, 135.11, 135.64
| Levels | Levels.1 |
|---|---|
| Previous Daily High | 134.57 |
| Previous Daily Low | 133.71 |
| Previous Weekly High | 134.04 |
| Previous Weekly Low | 131.83 |
| Previous Monthly High | 137.91 |
| Previous Monthly Low | 129.64 |
| Daily Fibonacci 38.2% | 134.24 |
| Daily Fibonacci 61.8% | 134.04 |
| Daily Pivot Point S1 | 133.92 |
| Daily Pivot Point S2 | 133.39 |
| Daily Pivot Point S3 | 133.06 |
| Daily Pivot Point R1 | 134.78 |
| Daily Pivot Point R2 | 135.11 |
| Daily Pivot Point R3 | 135.64 |
[/s2If]
Join Our Telegram Group
")


