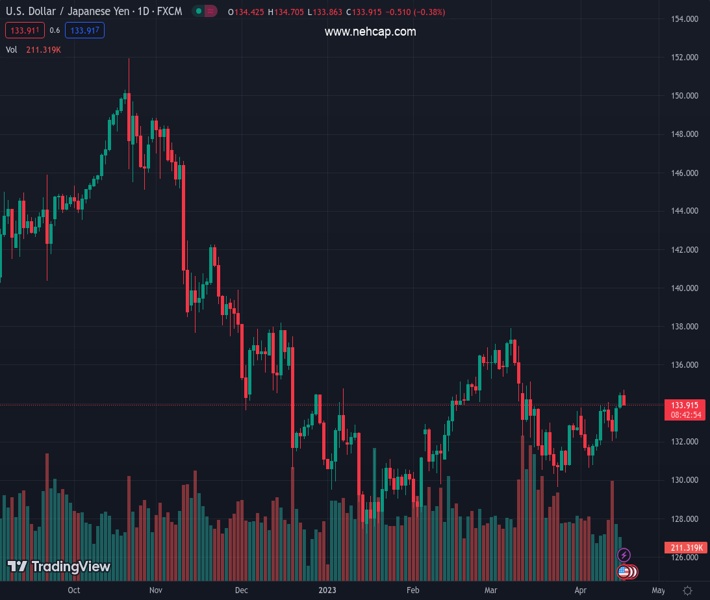
#USDJPY @ 133.906 pulls back from a multi-week high amid the emergence of fresh USD selling. (Pivot Orderbook analysis)
…
This is a premium post.
[s2If !current_user_can(access_s2member_level4)]Please register for PREMIUM VERSION HERE to read full post below containing analysis. In case of any error or you think you are not able to read the full post below, please email us at support#nehcap.com [lwa][/s2If] [s2If current_user_can(access_s2member_level4)]
- USD/JPY pulls back from a multi-week high amid the emergence of fresh USD selling.
- Elevated US Treasury bond yields should limit the USD losses and act as a tailwind.
- The BoJ’s dovish stance, a positive risk tone could undermine the JPY and lend support.
The pair currently trades last at 133.906.
The previous day high was 134.57 while the previous day low was 133.71. The daily 38.2% Fib levels comes at 134.24, expected to provide resistance. Similarly, the daily 61.8% fib level is at 134.04, expected to provide resistance.
The USD/JPY pair retreats from a nearly five-week high, around the 134.80 region touched earlier this Tuesday and extends its steady intraday descent through the mid-European session. Spot prices slide below the 134.00 mark in the last hour, eroding a major part of the previous day’s gains and snapping a two-day winning streak.
The US Dollar (USD) comes under some renewed selling pressure and stalls a two-day-old recovery trend from a one-year low set last week, which, in turn, is seen as a key factor dragging the USD/JPY pair lower. The better-than-forecast growth data from China, along with a hawkish tone from the Reserve Bank of Australia (RBA) meeting minutes, boost the Australian Dollar. Adding to this, stronger UK wage growth data supported the British Pound and turns out to be a key factor weighing on the Greenback.
That said, speculations that the Federal Reserve (Fed) will continue raising interest rates should help limit losses for the buck. In fact, the markets are pricing in a greater chance of another 25 bps lift-off at the next FOMC meeting in May, which keeps the US Treasury bond yields elevated. This results in the widening of the US-Japan rate differential, which along with the Bank of Japan’s (BoJ) dovish stance and a positive risk tone, undermine the safe-haven Japanese Yen (JPY) and lend some support to the USD/JPY pair.
The aforementioned fundamental backdrop makes it prudent to wait for strong follow-through selling before positioning for any further intraday depreciating move. Market participants now look forward to the US housing market data – Building Permits and Housing Starts – for a fresh impetus during the early North American session. Apart from this, the US bond yields will influence the USD price dynamics. Traders will further take cues from the broader risk sentiment to grab short-term opportunities around the USD/JPY pair.
Technical Levels: Supports and Resistances
USDJPY currently trading at 133.89 at the time of writing. Pair opened at 134.46 and is trading with a change of -0.42 % .
| Overview | Overview.1 | |
|---|---|---|
| 0 | Today last price | 133.89 |
| 1 | Today Daily Change | -0.57 |
| 2 | Today Daily Change % | -0.42 |
| 3 | Today daily open | 134.46 |
The pair is trading above its 20 Daily moving average @ 132.35, above its 50 Daily moving average @ 133.51 , above its 100 Daily moving average @ 133.1 and below its 200 Daily moving average @ 137.14
| Trends | Trends.1 | |
|---|---|---|
| 0 | Daily SMA20 | 132.35 |
| 1 | Daily SMA50 | 133.51 |
| 2 | Daily SMA100 | 133.10 |
| 3 | Daily SMA200 | 137.14 |
The previous day high was 134.57 while the previous day low was 133.71. The daily 38.2% Fib levels comes at 134.24, expected to provide resistance. Similarly, the daily 61.8% fib level is at 134.04, expected to provide resistance.
Note the levels of interest below:
- Pivot support is noted at 133.92, 133.39, 133.06
- Pivot resistance is noted at 134.78, 135.11, 135.64
| Levels | Levels.1 |
|---|---|
| Previous Daily High | 134.57 |
| Previous Daily Low | 133.71 |
| Previous Weekly High | 134.04 |
| Previous Weekly Low | 131.83 |
| Previous Monthly High | 137.91 |
| Previous Monthly Low | 129.64 |
| Daily Fibonacci 38.2% | 134.24 |
| Daily Fibonacci 61.8% | 134.04 |
| Daily Pivot Point S1 | 133.92 |
| Daily Pivot Point S2 | 133.39 |
| Daily Pivot Point S3 | 133.06 |
| Daily Pivot Point R1 | 134.78 |
| Daily Pivot Point R2 | 135.11 |
| Daily Pivot Point R3 | 135.64 |
[/s2If]
Join Our Telegram Group
")


