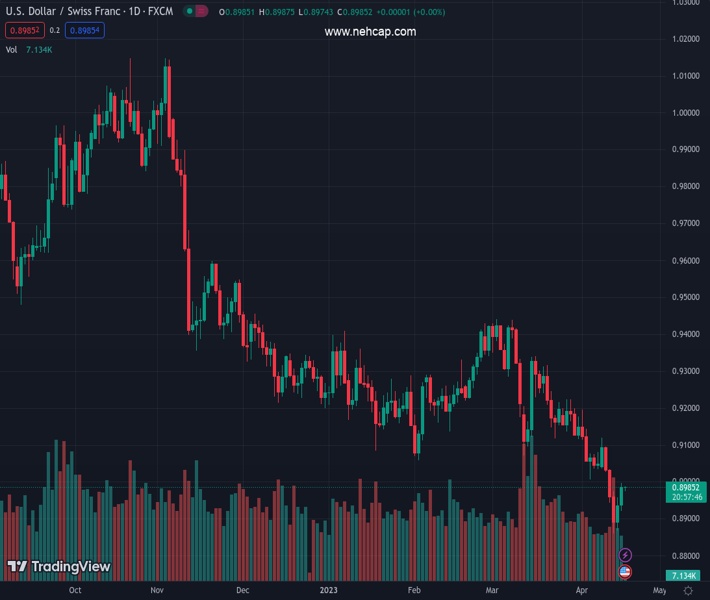
#USDCHF @ 0.89859 fades recovery from the lowest levels since January 2021. (Pivot Orderbook analysis)
…
This is a premium post.
[s2If !current_user_can(access_s2member_level4)]Please register for PREMIUM VERSION HERE to read full post below containing analysis. In case of any error or you think you are not able to read the full post below, please email us at support#nehcap.com [lwa][/s2If] [s2If current_user_can(access_s2member_level4)]
- USD/CHF fades recovery from the lowest levels since January 2021.
- US Dollar bulls take a breather after cheering upbeat US data, yields.
- Traders await more clues to extend latest US Dollar rebound.
- China GDP, risk catalysts and second-tier US data can entertain Swiss Franc pair buyers.
The pair currently trades last at 0.89859.
The previous day high was 0.8959 while the previous day low was 0.8867. The daily 38.2% Fib levels comes at 0.8924, expected to provide support. Similarly, the daily 61.8% fib level is at 0.8902, expected to provide support.
USD/CHF struggles to extend a two-day rebound from a multi-month low as it makes rounds to 0.8990-85 during early Tuesday. In doing so, the Swiss Franc (CHF) pair portrays the market’s inaction amid a cautious mood ahead of the key data from China, mainly important because of the latest recession talks.
Even so, the USD/CHF buyers remain hopeful amid the latest recovery in the US Dollar, mainly because of the firmer US Treasury bond yields and the hawkish Fed bets. That said, the US Dollar Index (DXY) stretched Friday’s rebound from a one-year low on Monday as upbeat US data and hawkish Fed talks joined the increasing odds of another Fed rate hike in May, as well as a reduction in the market’s bets suggesting a rate cut in later 2023. The same could be true for the US Treasury bond yields as the US 10-year and two-year bod coupons printed three-day uptrend to 3.60% and 4.20% respectively.
Talking about the data, the NY Empire State Manufacturing Index jumped to 10.8 for April while snapping the four-month downtrend, as well as marking the highest level since July last year. Further, the US National Association of Home Builders (NAHB) housing market index also rose for the fourth consecutive month in April to 45, versus 44 expected and prior reading.
On the other hand, Richmond Fed President Thomas Barkin said on Monday that he wants to see more evidence of inflation settling back to target. The policymaker also added that he feels reassured by what he is seeing in the banking sector.
Amid these plays, Wall Street closed positive but failed to challenge the US Dollar bulls amid hopes of further recovery and expectations that the US will be able to overcome the debt ceiling tension, expiring in June.
Moving on, the US Housing Starts and Building Permits for March will be important to watch for intraday directions. More importantly, talks of China’s faster economic recovery will be at the test as the Dragon Nation is up for releasing the first quarter (Q1) Gross Domestic Product (GDP) data and the same will be eyed closely for determining the market sentiment, which in turn affects the USD/CHF pair prices.
Although the RSI and MACD conditions are in favor of the USD/CHF pair’s further recovery, a three-week-old resistance line and a descending trend line from early March, respectively near 0.9010 and 0.9055, challenge the short-term buyers.
Technical Levels: Supports and Resistances
USDCHF currently trading at 0.8987 at the time of writing. Pair opened at 0.8937 and is trading with a change of 0.56% % .
| Overview | Overview.1 | |
|---|---|---|
| 0 | Today last price | 0.8987 |
| 1 | Today Daily Change | 0.0050 |
| 2 | Today Daily Change % | 0.56% |
| 3 | Today daily open | 0.8937 |
The pair remains strongly bearish on the daily time frame. It trades below the 20 SMA @ 0.9107, 50 SMA 0.9217, 100 SMA @ 0.9252 and 200 SMA @ 0.9489.
| Trends | Trends.1 | |
|---|---|---|
| 0 | Daily SMA20 | 0.9107 |
| 1 | Daily SMA50 | 0.9217 |
| 2 | Daily SMA100 | 0.9252 |
| 3 | Daily SMA200 | 0.9489 |
The previous day high was 0.8959 while the previous day low was 0.8867. The daily 38.2% Fib levels comes at 0.8924, expected to provide support. Similarly, the daily 61.8% fib level is at 0.8902, expected to provide support.
Note the levels of interest below:
- Pivot support is noted at 0.8883, 0.8829, 0.8791
- Pivot resistance is noted at 0.8975, 0.9013, 0.9067
| Levels | Levels.1 |
|---|---|
| Previous Daily High | 0.8959 |
| Previous Daily Low | 0.8867 |
| Previous Weekly High | 0.9114 |
| Previous Weekly Low | 0.8860 |
| Previous Monthly High | 0.9440 |
| Previous Monthly Low | 0.9072 |
| Daily Fibonacci 38.2% | 0.8924 |
| Daily Fibonacci 61.8% | 0.8902 |
| Daily Pivot Point S1 | 0.8883 |
| Daily Pivot Point S2 | 0.8829 |
| Daily Pivot Point S3 | 0.8791 |
| Daily Pivot Point R1 | 0.8975 |
| Daily Pivot Point R2 | 0.9013 |
| Daily Pivot Point R3 | 0.9067 |
[/s2If]
Join Our Telegram Group
")


