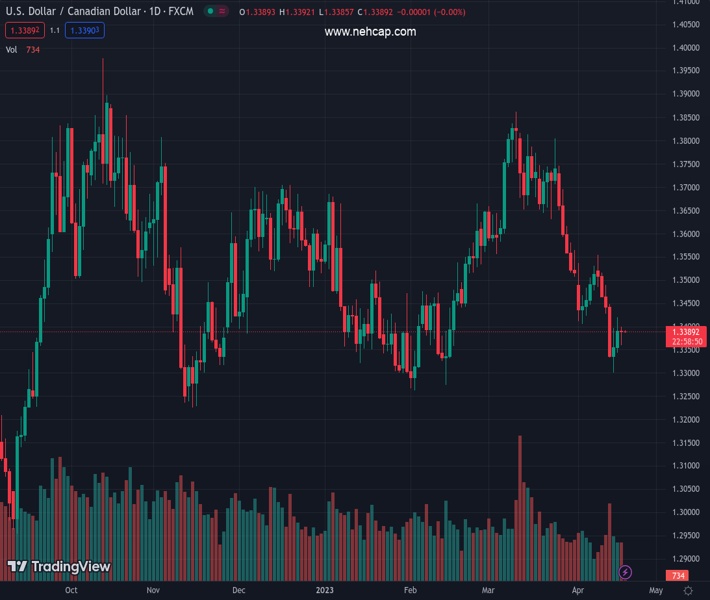
#USDCAD @ 1.33895 The lasted two days and was capped at 1.3400 as sellers piled on that area. (Pivot Orderbook analysis)
…
This is a premium post.
[s2If !current_user_can(access_s2member_level4)]Please register for PREMIUM VERSION HERE to read full post below containing analysis. In case of any error or you think you are not able to read the full post below, please email us at support#nehcap.com [lwa][/s2If] [s2If current_user_can(access_s2member_level4)]
- The USD/CAD lasted two days and was capped at 1.3400 as USD/CAD sellers piled on that area.
- If USD/CAD buyers reclaim 1.3400, a move towards the 100-day EMA at 1.3500 is on the cards.
The pair currently trades last at 1.33895.
The previous day high was 1.342 while the previous day low was 1.3343. The daily 38.2% Fib levels comes at 1.3391, expected to provide resistance. Similarly, the daily 61.8% fib level is at 1.3372, expected to provide support.
The USD/CAD rally was short-lived to just two days, but the pair remains above the 200-day Exponential Moving Average (EMA), suggesting that the neutral bias remains intact. At the time of typing, the USD/CAD is trading at 1.3389, below the 1.3400 figure, after hitting a high of 1.3399.
The USD/CAD is neutrally biased, though tilted to the downside, as the exchange rate is some ten pips shy of cracking below the 200-day EMA at 1.3377. The Relative Strength Index (RSI) is in bearish territory but shifted flat, while the Rate of Change (RoC) is about to turn neutral. Therefore, the path of least resistance in the near term could be downwards.
If USD/CAD tumbles below the 200-day EMA, the next support would be the April 14 swing low at 1.3300. A breach of the latter, and the USD/CAD pair will challenge the YTD low at 1.3262 before sliding towards the November 15 daily low at 1.3225, before threatening 1.3200.
On the flip side, if USD/CAD breaks above 1.3400, a rally toward the 20-day EMA At 1.3478 is on the cards, ahead of challenging the 100-day EMA at 1.3500. If buyers reclaim that area, nothing will be on the way toward the 50-day EMA at 1.3523, ahead of testing 1.3600.
Technical Levels: Supports and Resistances
USDCAD currently trading at 1.3392 at the time of writing. Pair opened at 1.3394 and is trading with a change of -0.01 % .
| Overview | Overview.1 | |
|---|---|---|
| 0 | Today last price | 1.3392 |
| 1 | Today Daily Change | -0.0002 |
| 2 | Today Daily Change % | -0.0100 |
| 3 | Today daily open | 1.3394 |
The pair remains strongly bearish on the daily time frame. It trades below the 20 SMA @ 1.3532, 50 SMA 1.3562, 100 SMA @ 1.353 and 200 SMA @ 1.3403.
| Trends | Trends.1 | |
|---|---|---|
| 0 | Daily SMA20 | 1.3532 |
| 1 | Daily SMA50 | 1.3562 |
| 2 | Daily SMA100 | 1.3530 |
| 3 | Daily SMA200 | 1.3403 |
The previous day high was 1.342 while the previous day low was 1.3343. The daily 38.2% Fib levels comes at 1.3391, expected to provide resistance. Similarly, the daily 61.8% fib level is at 1.3372, expected to provide support.
Note the levels of interest below:
- Pivot support is noted at 1.3351, 1.3308, 1.3273
- Pivot resistance is noted at 1.3428, 1.3463, 1.3506
| Levels | Levels.1 |
|---|---|
| Previous Daily High | 1.3420 |
| Previous Daily Low | 1.3343 |
| Previous Weekly High | 1.3554 |
| Previous Weekly Low | 1.3301 |
| Previous Monthly High | 1.3862 |
| Previous Monthly Low | 1.3508 |
| Daily Fibonacci 38.2% | 1.3391 |
| Daily Fibonacci 61.8% | 1.3372 |
| Daily Pivot Point S1 | 1.3351 |
| Daily Pivot Point S2 | 1.3308 |
| Daily Pivot Point S3 | 1.3273 |
| Daily Pivot Point R1 | 1.3428 |
| Daily Pivot Point R2 | 1.3463 |
| Daily Pivot Point R3 | 1.3506 |
[/s2If]
Join Our Telegram Group
")


