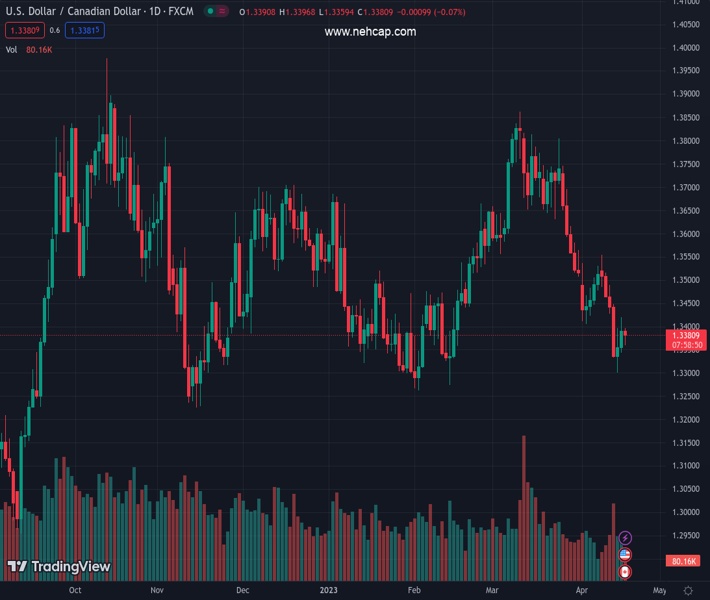
#USDCAD @ 1.33796 meets with some supply on Tuesday and snaps a two-day winning streak. (Pivot Orderbook analysis)
…
This is a premium post.
[s2If !current_user_can(access_s2member_level4)]Please register for PREMIUM VERSION HERE to read full post below containing analysis. In case of any error or you think you are not able to read the full post below, please email us at support#nehcap.com [lwa][/s2If] [s2If current_user_can(access_s2member_level4)]
- USD/CAD meets with some supply on Tuesday and snaps a two-day winning streak.
- A positive risk tone undermines the safe-haven USD and exerts pressure on the pair.
- The mostly inline Canadian inflation figures fail to provide any meaningful impetus.
The pair currently trades last at 1.33796.
The previous day high was 1.342 while the previous day low was 1.3343. The daily 38.2% Fib levels comes at 1.3391, expected to provide resistance. Similarly, the daily 61.8% fib level is at 1.3372, expected to provide support.
The USD/CAD pair recovers a few pips from the daily low and trades with modest intraday losses, around the 1.3380 region following the release of the latest Canadian consumer inflation figures.
Statistics Canada reported this Tuesday that the headline CPI rose 0.5% in March as compared to 0.4% in the previous month and the yearly rate decelerated from 5.2% in February to 4.3%, both matching consensus estimates. More importantly, the Bank of Canada’s (BoC) Core CPI, which excludes volatile food and energy prices, eased to a 4.3% YoY rate against market expectations for a fall to 4.2% from the 4.7% recorded in the previous month.
The data, meanwhile, does little to influence the Canadian Dollar, though broad-based US Dollar (USD) weakness continues to exert some downward pressure on the USD/CAD pair. The stronger-than-expected Chinese growth figures released earlier this Tuesday ease fears about a deeper global economic downturn and boost investors’ confidence. This remains supportive of a generally positive risk tone and undermines the safe-haven buck.
That said, speculations that the Federal Reserve (Fed) will continue lifting interest rates should act as a tailwind for the buck and help limit the downside for the USD/CAD pair, at least for the time being. In fact, the current market pricing indicates a greater chance of another 25 bps lift-off at the next FOMC meeting in May. This remains supportive of elevated US Treasury bond yields and supports prospects for the emergence of some USD dip-buying.
Hence, it will be prudent to wait for strong follow-through selling before confirming that the USD/CAD pair’s recent bounce from the 1.3300 mark, or a two-month low touched last week, has run its course. From a technical perspective, the overnight failure to find acceptance above the very important 200-day Simple Moving Average (SMA) warrants some caution for bullish traders and before positioning for any meaningful near-term appreciating move.
Technical Levels: Supports and Resistances
USDCAD currently trading at 1.3381 at the time of writing. Pair opened at 1.3394 and is trading with a change of -0.1 % .
| Overview | Overview.1 | |
|---|---|---|
| 0 | Today last price | 1.3381 |
| 1 | Today Daily Change | -0.0013 |
| 2 | Today Daily Change % | -0.1000 |
| 3 | Today daily open | 1.3394 |
The pair remains strongly bearish on the daily time frame. It trades below the 20 SMA @ 1.3532, 50 SMA 1.3562, 100 SMA @ 1.353 and 200 SMA @ 1.3403.
| Trends | Trends.1 | |
|---|---|---|
| 0 | Daily SMA20 | 1.3532 |
| 1 | Daily SMA50 | 1.3562 |
| 2 | Daily SMA100 | 1.3530 |
| 3 | Daily SMA200 | 1.3403 |
The previous day high was 1.342 while the previous day low was 1.3343. The daily 38.2% Fib levels comes at 1.3391, expected to provide resistance. Similarly, the daily 61.8% fib level is at 1.3372, expected to provide support.
Note the levels of interest below:
- Pivot support is noted at 1.3351, 1.3308, 1.3273
- Pivot resistance is noted at 1.3428, 1.3463, 1.3506
| Levels | Levels.1 |
|---|---|
| Previous Daily High | 1.3420 |
| Previous Daily Low | 1.3343 |
| Previous Weekly High | 1.3554 |
| Previous Weekly Low | 1.3301 |
| Previous Monthly High | 1.3862 |
| Previous Monthly Low | 1.3508 |
| Daily Fibonacci 38.2% | 1.3391 |
| Daily Fibonacci 61.8% | 1.3372 |
| Daily Pivot Point S1 | 1.3351 |
| Daily Pivot Point S2 | 1.3308 |
| Daily Pivot Point S3 | 1.3273 |
| Daily Pivot Point R1 | 1.3428 |
| Daily Pivot Point R2 | 1.3463 |
| Daily Pivot Point R3 | 1.3506 |
[/s2If]
Join Our Telegram Group
")


