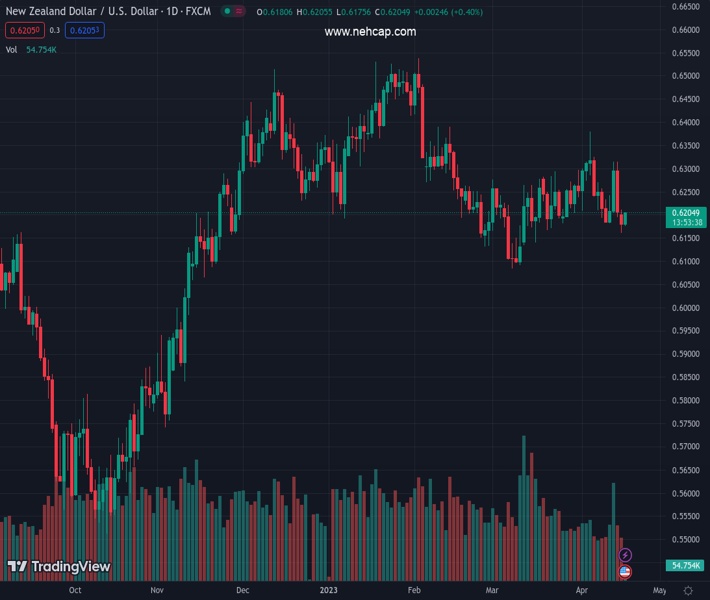
#NZDUSD @ 0.62044 picks up bids to extend early-day recovery from one-month low., @nehcap view: Further recovery expected (Pivot Orderbook analysis)
…
This is a premium post.
[s2If !current_user_can(access_s2member_level4)]Please register for PREMIUM VERSION HERE to read full post below containing analysis. In case of any error or you think you are not able to read the full post below, please email us at support#nehcap.com [lwa][/s2If] [s2If current_user_can(access_s2member_level4)]
- NZD/USD picks up bids to extend early-day recovery from one-month low.
- RSI, MACD conditions suggest Kiwi bears are running out of steam.
- Six-week-old previous support line, 200-SMA challenges NZD/USD buyers before giving them control.
- Sellers need validation from 0.6165 to retake control.
The pair currently trades last at 0.62044.
The previous day high was 0.6213 while the previous day low was 0.6161. The daily 38.2% Fib levels comes at 0.6181, expected to provide support. Similarly, the daily 61.8% fib level is at 0.6193, expected to provide support.
NZD/USD snaps a two-day downtrend while extending the early-day rebound from the lowest levels in a month during the initial hour of Tuesday’s European session.
In doing so, the Kiwi pair cheers China data-inspired optimism for the Antipodeans while approaching a 1.5-month-old previous support line, now immediate resistance around 0.6200.
Apart from the China data-led upbeat signals for NZD/USD, the RSI rebound from the oversold territory and the receding bearish bias of the MACD also keeps the buyers hopeful.
However, a clear upside break of the stated support-turned-resistance of around 0.6200 becomes necessary for the intraday buyers of the Kiwi pair. Even so, the 200-SMA level surrounding 0.6220 can act as an extra upside filter before giving control to the bulls.
Following that, the NZD/USD pair can approach a fortnight-long descending resistance line, close to 0.6290 by the press time.
On the flip side, a horizontal area comprising lows marked in the last month, near 0.6170-65, restricts the immediate downside of the Kiwi pair.
Also challenging the short-term NZD/USD bears is the 78.6% Fibonacci retracement of the pair’s March-April moves, near 0.6145.
Overall, NZD/USD is likely to witness a corrective bounce but the bullish trend is still unconvincing to expect.
Trend: Further recovery expected
Technical Levels: Supports and Resistances
NZDUSD currently trading at 0.6195 at the time of writing. Pair opened at 0.6182 and is trading with a change of 0.21% % .
| Overview | Overview.1 | |
|---|---|---|
| 0 | Today last price | 0.6195 |
| 1 | Today Daily Change | 0.0013 |
| 2 | Today Daily Change % | 0.21% |
| 3 | Today daily open | 0.6182 |
The pair is trading below its 20 Daily moving average @ 0.6241, below its 50 Daily moving average @ 0.6234 , below its 100 Daily moving average @ 0.6304 and above its 200 Daily moving average @ 0.6162
| Trends | Trends.1 | |
|---|---|---|
| 0 | Daily SMA20 | 0.6241 |
| 1 | Daily SMA50 | 0.6234 |
| 2 | Daily SMA100 | 0.6304 |
| 3 | Daily SMA200 | 0.6162 |
The previous day high was 0.6213 while the previous day low was 0.6161. The daily 38.2% Fib levels comes at 0.6181, expected to provide support. Similarly, the daily 61.8% fib level is at 0.6193, expected to provide support.
Note the levels of interest below:
- Pivot support is noted at 0.6158, 0.6133, 0.6106
- Pivot resistance is noted at 0.621, 0.6237, 0.6262
| Levels | Levels.1 |
|---|---|
| Previous Daily High | 0.6213 |
| Previous Daily Low | 0.6161 |
| Previous Weekly High | 0.6316 |
| Previous Weekly Low | 0.6169 |
| Previous Monthly High | 0.6298 |
| Previous Monthly Low | 0.6084 |
| Daily Fibonacci 38.2% | 0.6181 |
| Daily Fibonacci 61.8% | 0.6193 |
| Daily Pivot Point S1 | 0.6158 |
| Daily Pivot Point S2 | 0.6133 |
| Daily Pivot Point S3 | 0.6106 |
| Daily Pivot Point R1 | 0.6210 |
| Daily Pivot Point R2 | 0.6237 |
| Daily Pivot Point R3 | 0.6262 |
[/s2If]
Join Our Telegram Group
")


