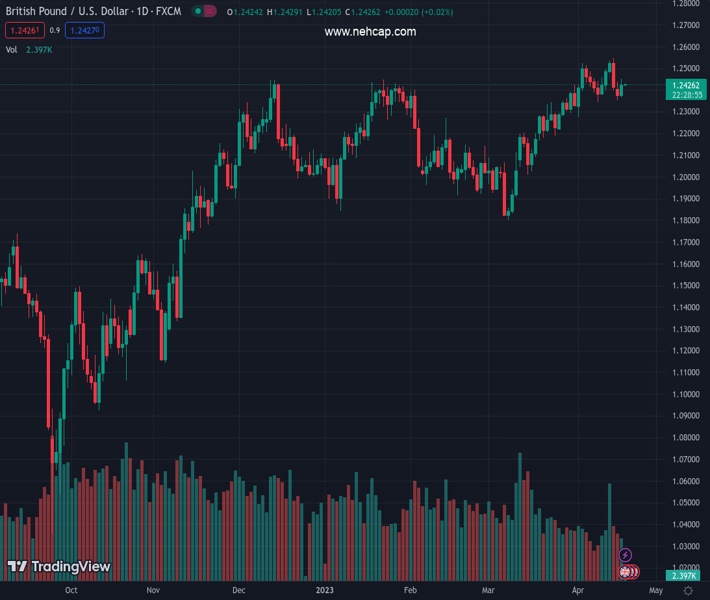
#GBPUSD @ 1.24281 struggles to extend the previous day’s corrective bounce off one-week low., @nehcap view: Further upside expected (Pivot Orderbook analysis)
…
This is a premium post.
[s2If !current_user_can(access_s2member_level4)]Please register for PREMIUM VERSION HERE to read full post below containing analysis. In case of any error or you think you are not able to read the full post below, please email us at support#nehcap.com [lwa][/s2If] [s2If current_user_can(access_s2member_level4)]
- GBP/USD struggles to extend the previous day’s corrective bounce off one-week low.
- 12-day-old rising wedge bearish chart formation keeps sellers hopeful.
- Lackluster MACD, sustained trading beyond 200-SMA keeps buyers hopeful.
The pair currently trades last at 1.24281.
The previous day high was 1.2438 while the previous day low was 1.2354. The daily 38.2% Fib levels comes at 1.2386, expected to provide support. Similarly, the daily 61.8% fib level is at 1.2406, expected to provide support.
GBP/USD makes rounds to 1.2425-20 within a two-week-old rising wedge bearish chart formation during early Wednesday morning in Asia. In doing so, the quote portrays a cautious mood ahead of the key UK inflation data for March, namely the Consumer Price Index (CPI).
The Cable pair recently bounced off the bottom line of the stated rising wedge, which in turn joins the steady RSI (14) to suggest further recovery of the quote. However, the 21-SMA surrounding 1.2435 restricts the immediate upside of the GBP/USD price.
Following that, the 1.2500 round figure and the top line of the aforementioned bearish chart formation, around 1.2555 by the press time, could challenge the Cable pair buyers.
Should the GBP/USD price remains firmer past 1.2555, it defies the bearish chart formation and can propel the quote toward the May 2022 high of near 1.2665. That said, the 1.2600 round figure may act as an intermediate halt during the run-up.
Alternatively, a downside break of 1.2365 confirms the rising wedge bearish pattern and suggests a theoretical fall targeting 1.2000 psychological magnet. However, the 200-SMA level can act as an extra filter towards the south, around 1.2265.
It should be observed that the highs marked in mid-March around 1.2200 can also act as extra support to watch during the GBP/USD pair’s fall past 1.2365.
Trend: Further upside expected
Technical Levels: Supports and Resistances
GBPUSD currently trading at 1.2428 at the time of writing. Pair opened at 1.2376 and is trading with a change of 0.42 % .
| Overview | Overview.1 | |
|---|---|---|
| 0 | Today last price | 1.2428 |
| 1 | Today Daily Change | 0.0052 |
| 2 | Today Daily Change % | 0.4200 |
| 3 | Today daily open | 1.2376 |
The pair remains strongly bullish on the daily timeframe. It trades above its 20 SMA @ 1.2375, 50 SMA 1.218, 100 SMA @ 1.2186 and 200 SMA @ 1.1915.
| Trends | Trends.1 | |
|---|---|---|
| 0 | Daily SMA20 | 1.2375 |
| 1 | Daily SMA50 | 1.2180 |
| 2 | Daily SMA100 | 1.2186 |
| 3 | Daily SMA200 | 1.1915 |
The previous day high was 1.2438 while the previous day low was 1.2354. The daily 38.2% Fib levels comes at 1.2386, expected to provide support. Similarly, the daily 61.8% fib level is at 1.2406, expected to provide support.
Note the levels of interest below:
- Pivot support is noted at 1.234, 1.2305, 1.2256
- Pivot resistance is noted at 1.2425, 1.2474, 1.251
| Levels | Levels.1 |
|---|---|
| Previous Daily High | 1.2438 |
| Previous Daily Low | 1.2354 |
| Previous Weekly High | 1.2546 |
| Previous Weekly Low | 1.2344 |
| Previous Monthly High | 1.2424 |
| Previous Monthly Low | 1.1803 |
| Daily Fibonacci 38.2% | 1.2386 |
| Daily Fibonacci 61.8% | 1.2406 |
| Daily Pivot Point S1 | 1.2340 |
| Daily Pivot Point S2 | 1.2305 |
| Daily Pivot Point S3 | 1.2256 |
| Daily Pivot Point R1 | 1.2425 |
| Daily Pivot Point R2 | 1.2474 |
| Daily Pivot Point R3 | 1.2510 |
[/s2If]
Join Our Telegram Group
")


