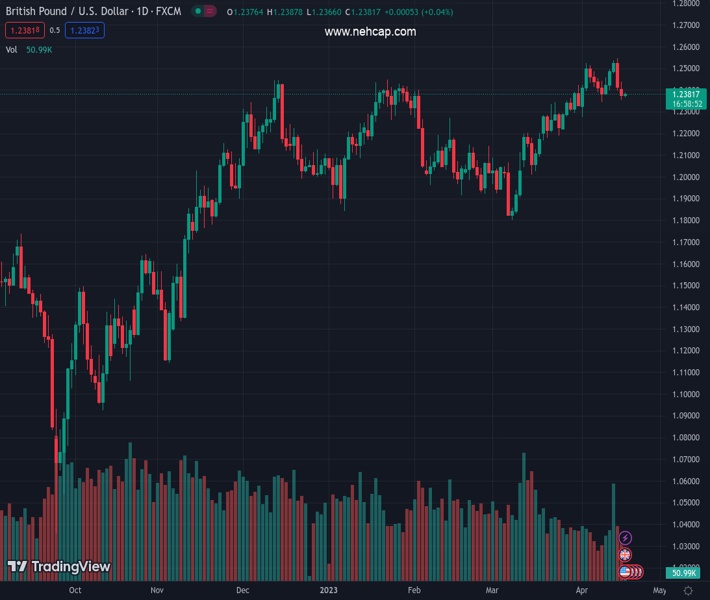
#GBPUSD @ 1.23832 is marching towards 1.2400 ahead of UK labor market data. (Pivot Orderbook analysis)
…
This is a premium post.
[s2If !current_user_can(access_s2member_level4)]Please register for PREMIUM VERSION HERE to read full post below containing analysis. In case of any error or you think you are not able to read the full post below, please email us at support#nehcap.com [lwa][/s2If] [s2If current_user_can(access_s2member_level4)]
- GBP/USD is marching towards 1.2400 ahead of UK labor market data.
- March’s UK Employment data will have a significant impact on the interest rate decision by the BoE.
- A mind correction in the USD Index to 102.00 has provided some support to the cable.
The pair currently trades last at 1.23832.
The previous day high was 1.2438 while the previous day low was 1.2354. The daily 38.2% Fib levels comes at 1.2386, expected to provide resistance. Similarly, the daily 61.8% fib level is at 1.2406, expected to provide resistance.
The GBP/USD pair has extended its recovery above the immediate resistance of 1.2380 in the Asian session. The Cable is approaching the round-level resistance of 1.2400 ahead of the release of the United Kingdom Employment data.
Sheer volatility is expected from the Pound Sterling as the labor market data will have a significant impact on the interest rate decision by the Bank of England (BoE), which is scheduled for May. The Claimant Count Change is expected to decline by 11.8k, higher than the former release of 11.2K. The continuous addition of job seekers into the labor force indicates tight labor market conditions. Three-month Unemployment Rate is likely to remain steady at 3.7%. Average Earnings excluding bonuses are expected to soften to 6.2% from the former recording of 6.5%.
The US Dollar Index (DXY) has slipped to near 102.00, showing lackluster performance amid an absence of economic indicators this week. However, investors will keep an eye on the Federal Reserve’s (Fed) Beige Book, which provides the current economic situation of 12 Fed districts.
GBP/USD has shifted into a bearish trajectory after a breakdown of the Ascending Triangle chart pattern formed on a two-hour scale. The upward-sloping trendline of the aforementioned chart pattern is plotted from March 24 low at 1.2191 while the horizontal resistance is placed from April 04 high at 1.2525.
The 20-period Exponential Moving Average (EMA) at 1.2404 is acting as a barricade for the Pound Sterling bulls.
Meanwhile, the Relative Strength Index (RSI) (14) is oscillating in the bearish range of 20.00-40.000, indicating the downside momentum is active.
A slippage below April 10 low at 1.2345 will expose the asset to March 30 low at 1.2294 followed by March 27 low at 1.2219.
On the flip side, a recovery move above April 13 high at 1.2537 will drive the asset towards a fresh 10-month high at 1.2597, which is 08 June 2022 high. A breach of the latter will expose the asset to May 27 high at 1.2667.
Technical Levels: Supports and Resistances
GBPUSD currently trading at 1.2383 at the time of writing. Pair opened at 1.2376 and is trading with a change of 0.06 % .
| Overview | Overview.1 | |
|---|---|---|
| 0 | Today last price | 1.2383 |
| 1 | Today Daily Change | 0.0007 |
| 2 | Today Daily Change % | 0.0600 |
| 3 | Today daily open | 1.2376 |
The pair remains strongly bullish on the daily timeframe. It trades above its 20 SMA @ 1.2375, 50 SMA 1.218, 100 SMA @ 1.2186 and 200 SMA @ 1.1915.
| Trends | Trends.1 | |
|---|---|---|
| 0 | Daily SMA20 | 1.2375 |
| 1 | Daily SMA50 | 1.2180 |
| 2 | Daily SMA100 | 1.2186 |
| 3 | Daily SMA200 | 1.1915 |
The previous day high was 1.2438 while the previous day low was 1.2354. The daily 38.2% Fib levels comes at 1.2386, expected to provide resistance. Similarly, the daily 61.8% fib level is at 1.2406, expected to provide resistance.
Note the levels of interest below:
- Pivot support is noted at 1.234, 1.2305, 1.2256
- Pivot resistance is noted at 1.2425, 1.2474, 1.251
| Levels | Levels.1 |
|---|---|
| Previous Daily High | 1.2438 |
| Previous Daily Low | 1.2354 |
| Previous Weekly High | 1.2546 |
| Previous Weekly Low | 1.2344 |
| Previous Monthly High | 1.2424 |
| Previous Monthly Low | 1.1803 |
| Daily Fibonacci 38.2% | 1.2386 |
| Daily Fibonacci 61.8% | 1.2406 |
| Daily Pivot Point S1 | 1.2340 |
| Daily Pivot Point S2 | 1.2305 |
| Daily Pivot Point S3 | 1.2256 |
| Daily Pivot Point R1 | 1.2425 |
| Daily Pivot Point R2 | 1.2474 |
| Daily Pivot Point R3 | 1.2510 |
[/s2If]
Join Our Telegram Group
")


