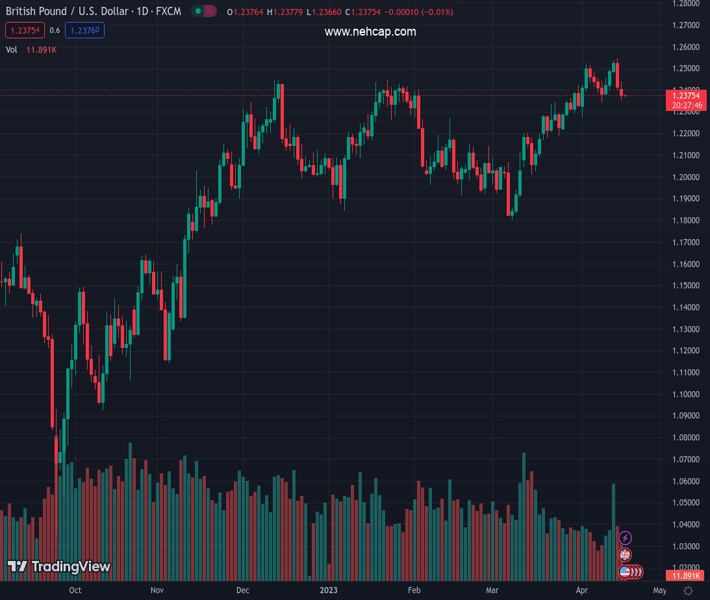
#GBPUSD @ 1.23750 treads water after two-day downtrend, sidelined of late. (Pivot Orderbook analysis)
…
This is a premium post.
[s2If !current_user_can(access_s2member_level4)]Please register for PREMIUM VERSION HERE to read full post below containing analysis. In case of any error or you think you are not able to read the full post below, please email us at support#nehcap.com [lwa][/s2If] [s2If current_user_can(access_s2member_level4)]
- GBP/USD treads water after two-day downtrend, sidelined of late.
- UK Employment Change for March, ILO Unemployment Rate for three months to February will be crucial for fresh impulse.
- Broad US Dollar rebound joins downbeat forecasts for British job data to weigh on Cable price.
- Risk catalysts, Fed, BoE talks also eyed for clear directions.
The pair currently trades last at 1.23750.
The previous day high was 1.2438 while the previous day low was 1.2354. The daily 38.2% Fib levels comes at 1.2386, expected to provide resistance. Similarly, the daily 61.8% fib level is at 1.2406, expected to provide resistance.
GBP/USD remains sidelined around 1.2380 amid early Tuesday’s sluggish session, snapping a two-day downtrend ahead of the key UK jobs report. Even so, the latest hawkish concerns surrounding the Federal Reserve (Fed), versus likely downbeat job figures from Britain, keeps the bears hopeful.
On Monday, the US Dollar Index (DXY) stretched Friday’s rebound from a one-year low as upbeat US data and hawkish Fed talks joined the increasing odds of another Fed rate hike in May, as well as a reduction in the market’s bets suggesting a rate cut in later 2023. The same could be true for the US Treasury bond yields as the US 10-year and two-year bod coupons printed three-day uptrend to 3.60% and 4.20% respectively.
Talking about the data, the NY Empire State Manufacturing Index jumped to 10.8 for April while snapping the four-month downtrend, as well as marking the highest level since July last year. Further, the US National Association of Home Builders (NAHB) housing market index also rose for the fourth consecutive month in April to 45, versus 44 expected and prior reading. Elsewhere, Richmond Fed President Thomas Barkin said on Monday that he wants to see more evidence of inflation settling back to target. The policymaker also added that he feels reassured by what he is seeing in the banking sector.
At home, British politics are in play as UK PM Rishi Sunak is accused of a lack of childcare declaration as he is up for an awkward dinner with Boris Johnson and Liz Truss. Furthermore, the latest warning from the UK’s top security Chief propels geopolitical fears and challenges the GBP/USD bulls. “Lindy Cameron, head of the National Cyber Security Centre (NCSC), will say that the UK and its allies cannot afford complacency over the ‘dramatic rise of China as a technology superpower,’” reported The Times.
Moving on, UK’s headline Claimant Count Change for March is expected to deteriorate further with -11.8K versus -11.2K prior whereas the ILO Unemployment Rate for three months to February may remain unchanged at 3.7%. However, a likely easing in the average earnings including and excluding bonuses for three months to February could join the anticipated increase in persons applying for unemployment claims to weigh on the GBP/USD prices. On the other hand, the US Housing Starts and Building Permits for March could join the central bankers’ comments to direct intraday moves of the Cable pair.
A clear downside break of an upward-sloping support line from March 24, now immediate resistance near 1.2435, joins bearish MACD signals to lure the GBP/USD bears ahead of the key UK statistics. However, the 21-DMA challenges the pair sellers around 1.2375 of late.
Technical Levels: Supports and Resistances
GBPUSD currently trading at 1.2373 at the time of writing. Pair opened at 1.2376 and is trading with a change of -0.02% % .
| Overview | Overview.1 | |
|---|---|---|
| 0 | Today last price | 1.2373 |
| 1 | Today Daily Change | -0.0003 |
| 2 | Today Daily Change % | -0.02% |
| 3 | Today daily open | 1.2376 |
The pair is trading below its 20 Daily moving average @ 1.2375, above its 50 Daily moving average @ 1.218 , above its 100 Daily moving average @ 1.2186 and above its 200 Daily moving average @ 1.1915
| Trends | Trends.1 | |
|---|---|---|
| 0 | Daily SMA20 | 1.2375 |
| 1 | Daily SMA50 | 1.2180 |
| 2 | Daily SMA100 | 1.2186 |
| 3 | Daily SMA200 | 1.1915 |
The previous day high was 1.2438 while the previous day low was 1.2354. The daily 38.2% Fib levels comes at 1.2386, expected to provide resistance. Similarly, the daily 61.8% fib level is at 1.2406, expected to provide resistance.
Note the levels of interest below:
- Pivot support is noted at 1.234, 1.2305, 1.2256
- Pivot resistance is noted at 1.2425, 1.2474, 1.251
| Levels | Levels.1 |
|---|---|
| Previous Daily High | 1.2438 |
| Previous Daily Low | 1.2354 |
| Previous Weekly High | 1.2546 |
| Previous Weekly Low | 1.2344 |
| Previous Monthly High | 1.2424 |
| Previous Monthly Low | 1.1803 |
| Daily Fibonacci 38.2% | 1.2386 |
| Daily Fibonacci 61.8% | 1.2406 |
| Daily Pivot Point S1 | 1.2340 |
| Daily Pivot Point S2 | 1.2305 |
| Daily Pivot Point S3 | 1.2256 |
| Daily Pivot Point R1 | 1.2425 |
| Daily Pivot Point R2 | 1.2474 |
| Daily Pivot Point R3 | 1.2510 |
[/s2If]
Join Our Telegram Group
")


