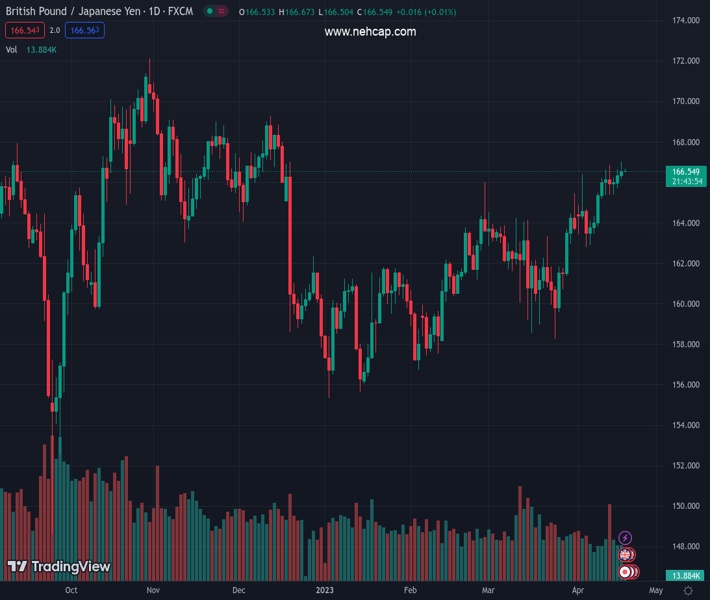
#GBPJPY @ 166.547 uptrend is still active but facing tough resistance at around 167.00. (Pivot Orderbook analysis)
…
This is a premium post.
[s2If !current_user_can(access_s2member_level4)]Please register for PREMIUM VERSION HERE to read full post below containing analysis. In case of any error or you think you are not able to read the full post below, please email us at support#nehcap.com [lwa][/s2If] [s2If current_user_can(access_s2member_level4)]
- GBP/JPY uptrend is still active but facing tough resistance at around 167.00.
- Downside risks in the GBP/JPY lie below 166.16, followed by 166.00.
The pair currently trades last at 166.547.
The previous day high was 166.64 while the previous day low was 165.7. The daily 38.2% Fib levels comes at 166.28, expected to provide support. Similarly, the daily 61.8% fib level is at 166.06, expected to provide support.
The GBP/JPY stalls at around 166.60s, unable to crack the YTD high at 167.00, printed on Tuesday, as Wednesday’s Asian session commence. Nevertheless, the GBP/JPY uptrend remains intact unless the quote tumbles below the last week’s low of 165.40, which could pave the way for further losses.
Given the backdrop, the GBP/JPY recent trend stays in play, though it’s facing a wall of resistance. However, if it clears 167.00, a leg up toward the December 16 high at 168.00 might be on the cards. The move could be denied if the Relative Strength Index (RSI) enters the oversold territory, which it’s about to happen.
The Rate of Change (RoC) suggests that the pair is peaking near the 167.00 area, with volatility shrinking towards neutral levels. Therefore, don’t discount that sellers could step in should traders’ sentiment deteriorates, which could open the door for a pullback.
If GBP/JPY drops below the April 18 daily low of 166.16, that could pave the way to test the 166.00 round number. Once cleared, a dip toward the 20-day Exponential Moving Average (EMA at 164.69 is on the cards. But some hurdles on the way south must be surpassed, like the April 14 low at 165.40, followed by the 165.00 figure.
Technical Levels: Supports and Resistances
GBPJPY currently trading at 166.57 at the time of writing. Pair opened at 166.41 and is trading with a change of 0.1 % .
| Overview | Overview.1 | |
|---|---|---|
| 0 | Today last price | 166.57 |
| 1 | Today Daily Change | 0.16 |
| 2 | Today Daily Change % | 0.10 |
| 3 | Today daily open | 166.41 |
The pair remains strongly bullish on the daily timeframe. It trades above its 20 SMA @ 163.78, 50 SMA 162.6, 100 SMA @ 162.17 and 200 SMA @ 163.22.
| Trends | Trends.1 | |
|---|---|---|
| 0 | Daily SMA20 | 163.78 |
| 1 | Daily SMA50 | 162.60 |
| 2 | Daily SMA100 | 162.17 |
| 3 | Daily SMA200 | 163.22 |
The previous day high was 166.64 while the previous day low was 165.7. The daily 38.2% Fib levels comes at 166.28, expected to provide support. Similarly, the daily 61.8% fib level is at 166.06, expected to provide support.
Note the levels of interest below:
- Pivot support is noted at 165.86, 165.31, 164.92
- Pivot resistance is noted at 166.8, 167.19, 167.74
| Levels | Levels.1 |
|---|---|
| Previous Daily High | 166.64 |
| Previous Daily Low | 165.70 |
| Previous Weekly High | 166.85 |
| Previous Weekly Low | 163.81 |
| Previous Monthly High | 165.47 |
| Previous Monthly Low | 158.27 |
| Daily Fibonacci 38.2% | 166.28 |
| Daily Fibonacci 61.8% | 166.06 |
| Daily Pivot Point S1 | 165.86 |
| Daily Pivot Point S2 | 165.31 |
| Daily Pivot Point S3 | 164.92 |
| Daily Pivot Point R1 | 166.80 |
| Daily Pivot Point R2 | 167.19 |
| Daily Pivot Point R3 | 167.74 |
[/s2If]
Join Our Telegram Group
")


