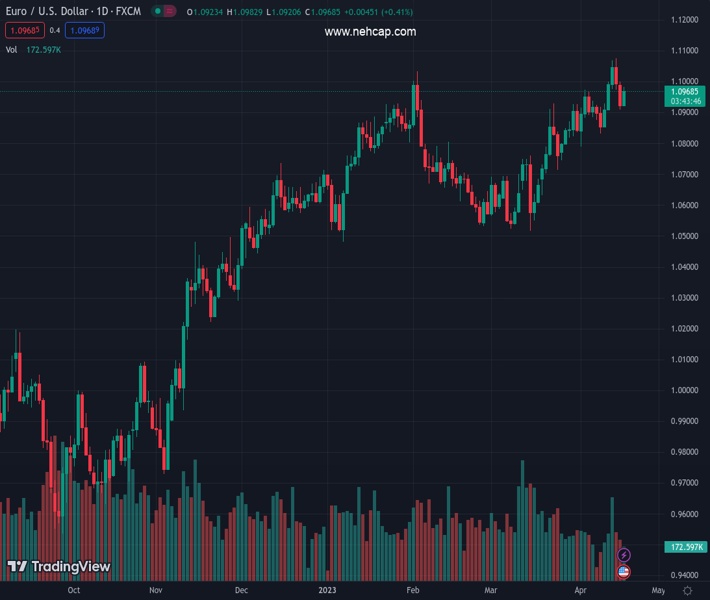
#EURUSD @ 1.09704 Federal Reserve’s policymakers’ hawkish comments did not underpin the US Dollar (Pivot Orderbook analysis)
…
This is a premium post.
[s2If !current_user_can(access_s2member_level4)]Please register for PREMIUM VERSION HERE to read full post below containing analysis. In case of any error or you think you are not able to read the full post below, please email us at support#nehcap.com [lwa][/s2If] [s2If current_user_can(access_s2member_level4)]
- Federal Reserve’s policymakers’ hawkish comments did not underpin the US Dollar
- US housing data missed estimates, though EUR/USD traders ignored it.
- EUR/USD Price Analysis: Upside risks lie at 1.1000, potentially exposing the YTD high; downside risks are below 1.0900.
The pair currently trades last at 1.09704.
The previous day high was 1.1 while the previous day low was 1.0909. The daily 38.2% Fib levels comes at 1.0944, expected to provide support. Similarly, the daily 61.8% fib level is at 1.0965, expected to provide support.
EUR/USD snaps two days of consecutive losses and climbs, and seesaws around the 1.0950 figure, spurred by falling US Treasury bond yields and broad American Dollar (USD) weakness. Hence, the EUR/USD is trading at 1.0961 after hitting a low of 1.0920.
Sentiment deteriorated as Wall Street registers losses. Federal Reserve officials led by the St. Louis Fed President James Bullard reinforced the need for further tightening. Nevertheless, Bullard commented that he does not see a recession and expects rates to go between 5.50% and 5.75%. Of late, Atlanta’s Fed President Raphael Bostic noted that he estimates another hike and then a pause. He added that inflation would take some time to ease to the Fed’s target, and he also does not foresee a recession.
In the meantime, Federal Reserve’s expectations for the May meeting lie at an 86.7% chance for a 25 bps hike, according to the CME FedWatch Tool.
In terms of data, the economic agenda in the US showcased a decline of 0.80% month-over-month in Housing Starts for March, following a 7.3% surge in February (revised down from 9.8%). Meanwhile, Building Permits fell by 8.8%, which was lower than the expected gain of 1.45%, although the figures for February were revised upward to 15.8% from 13.8%.
On the Eurozone (EU) front, the European Central Bank (ECB) Chief Economist Philip Lane said the ECB’s baseline is to raise rates at the May 4 meeting. He added that data showed that supply chain shocks have eased and lower energy prices would help tackle inflation. Lastly, he said that the ECB is in “wait-and-see mode.”
The EU’s calendar featured Germany’s Zew Index for April. Although they remained optimistic, expectations for future conditions missed estimates at 4.1 vs. 15.6 forecasts. Regarding current conditions, the index was -32.5 less than the -40 expected, an improvement considering that the prior’s month reading was -46.5. A senior ZEW official noted that “Experts expect banks to be more cautious in granting loans” and added that “high inflation rates and the internationally restrictive monetary policy are also weighing on the economy.”
From a daily chart perspective, the EUR/USD is still upward biased, with the 20-day Exponential Moving Average (EMA) tracking the price action as a dynamic support. The 1.50% drop from April 14 to 17 was capped around 1.0909 before bouncing off from the latter toward current exchange rates. Although mixed, oscillators suggest that the EUR/USD could be poised for another leg-up.
If EUR/USD cracks 1.1000, that could put into play a challenge of the YTD high at 1.1075 before testing 1.1100. On the other hand, a fall below 1.0900, and the EUR/USD could dip to the 20-day EMA At 1.0890 before plunging to the 50-day EMA At 1.0795.
Technical Levels: Supports and Resistances
EURUSD currently trading at 1.097 at the time of writing. Pair opened at 1.0925 and is trading with a change of 0.41 % .
| Overview | Overview.1 | |
|---|---|---|
| 0 | Today last price | 1.0970 |
| 1 | Today Daily Change | 0.0045 |
| 2 | Today Daily Change % | 0.4100 |
| 3 | Today daily open | 1.0925 |
The pair remains strongly bullish on the daily timeframe. It trades above its 20 SMA @ 1.0888, 50 SMA 1.0747, 100 SMA @ 1.0716 and 200 SMA @ 1.0375.
| Trends | Trends.1 | |
|---|---|---|
| 0 | Daily SMA20 | 1.0888 |
| 1 | Daily SMA50 | 1.0747 |
| 2 | Daily SMA100 | 1.0716 |
| 3 | Daily SMA200 | 1.0375 |
The previous day high was 1.1 while the previous day low was 1.0909. The daily 38.2% Fib levels comes at 1.0944, expected to provide support. Similarly, the daily 61.8% fib level is at 1.0965, expected to provide support.
Note the levels of interest below:
- Pivot support is noted at 1.089, 1.0854, 1.0799
- Pivot resistance is noted at 1.098, 1.1035, 1.1071
| Levels | Levels.1 |
|---|---|
| Previous Daily High | 1.1000 |
| Previous Daily Low | 1.0909 |
| Previous Weekly High | 1.1076 |
| Previous Weekly Low | 1.0837 |
| Previous Monthly High | 1.0930 |
| Previous Monthly Low | 1.0516 |
| Daily Fibonacci 38.2% | 1.0944 |
| Daily Fibonacci 61.8% | 1.0965 |
| Daily Pivot Point S1 | 1.0890 |
| Daily Pivot Point S2 | 1.0854 |
| Daily Pivot Point S3 | 1.0799 |
| Daily Pivot Point R1 | 1.0980 |
| Daily Pivot Point R2 | 1.1035 |
| Daily Pivot Point R3 | 1.1071 |
[/s2If]
Join Our Telegram Group
")


