#EURJPY @ 147.050 fluctuates as the Asian session begins and stays above the 147.00 mark. (Pivot Orderbook analysis)
…
This is a premium post.
[s2If !current_user_can(access_s2member_level4)]Please register for PREMIUM VERSION HERE to read full post below containing analysis. In case of any error or you think you are not able to read the full post below, please email us at support#nehcap.com [lwa][/s2If] [s2If current_user_can(access_s2member_level4)]
- EUR/JPY fluctuates as the Asian session begins and stays above the 147.00 mark.
- Sentiment shifted sour, keeping the EUR/JPY from breaking to new YTD highs above 147.45.
The pair currently trades last at 147.050.
The previous day high was 147.45 while the previous day low was 146.67. The daily 38.2% Fib levels comes at 146.97, expected to provide support. Similarly, the daily 61.8% fib level is at 147.15, expected to provide resistance.
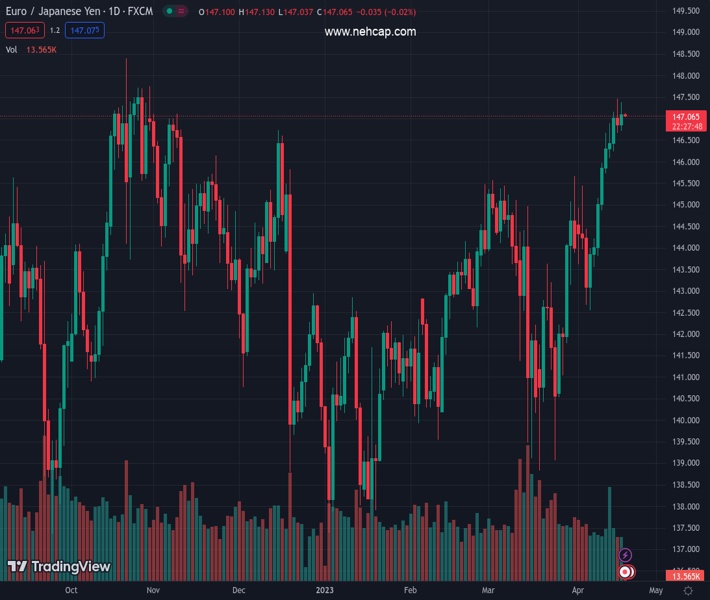
EUR/JPY trades almost flat as the Asian session begins. At the time of writing, the EUR/JPY exchanges hand at 147.09 after hitting a weekly high at 147.45 on Monday and achieving gains of 0.17% on Tuesday.
Wall Street finished Tuesday’s session almost unchanged as market participants assessed comments from US Federal Reserve officials. Sentiment remains sour, though the CBOE Volatility Index (VIX) remains below 17, its lowest level since January 2022. Stock’s failure to rally on the VIX edging lower suggests investors could park cash aside amidst uncertainty regarding the Federal Funds rate (FFR) peak.
The EUR/JPY remains upward biased, though on Monday printed a new YTD high at 147.45. The Relative Strength Index (RSI) remained in bullish territory and shifted flat, while the Rate of Change (RoC) is neutral. Hence, those two signals indicate that the EUR/JPY could remain sideways within the 146.72-147.50 area.
If EUR/JPY resumes its uptrend, its first resistance would be 147.45. A breach of the latter will expose the 147.75 area, followed by the 148.00 mark and the 2022 high at 148.40. On the other hand, the EUR/JPY first support would be the December 15 high turned support at 146.72. Once cleared, the cross-currency could tumble towards the December 20 high-shifted-support at 145.83 before testing the 20-day EMA At 145.09.
Technical Levels: Supports and Resistances
EURJPY currently trading at 147.09 at the time of writing. Pair opened at 146.93 and is trading with a change of 0.11 % .
| Overview | Overview.1 | |
|---|---|---|
| 0 | Today last price | 147.09 |
| 1 | Today Daily Change | 0.16 |
| 2 | Today Daily Change % | 0.11 |
| 3 | Today daily open | 146.93 |
The pair remains strongly bullish on the daily timeframe. It trades above its 20 SMA @ 144.08, 50 SMA 143.45, 100 SMA @ 142.59 and 200 SMA @ 142.1.
| Trends | Trends.1 | |
|---|---|---|
| 0 | Daily SMA20 | 144.08 |
| 1 | Daily SMA50 | 143.45 |
| 2 | Daily SMA100 | 142.59 |
| 3 | Daily SMA200 | 142.10 |
The previous day high was 147.45 while the previous day low was 146.67. The daily 38.2% Fib levels comes at 146.97, expected to provide support. Similarly, the daily 61.8% fib level is at 147.15, expected to provide resistance.
Note the levels of interest below:
- Pivot support is noted at 146.58, 146.23, 145.8
- Pivot resistance is noted at 147.36, 147.8, 148.14
| Levels | Levels.1 |
|---|---|
| Previous Daily High | 147.45 |
| Previous Daily Low | 146.67 |
| Previous Weekly High | 147.16 |
| Previous Weekly Low | 143.80 |
| Previous Monthly High | 145.67 |
| Previous Monthly Low | 138.83 |
| Daily Fibonacci 38.2% | 146.97 |
| Daily Fibonacci 61.8% | 147.15 |
| Daily Pivot Point S1 | 146.58 |
| Daily Pivot Point S2 | 146.23 |
| Daily Pivot Point S3 | 145.80 |
| Daily Pivot Point R1 | 147.36 |
| Daily Pivot Point R2 | 147.80 |
| Daily Pivot Point R3 | 148.14 |
[/s2If]
Join Our Telegram Group
")


