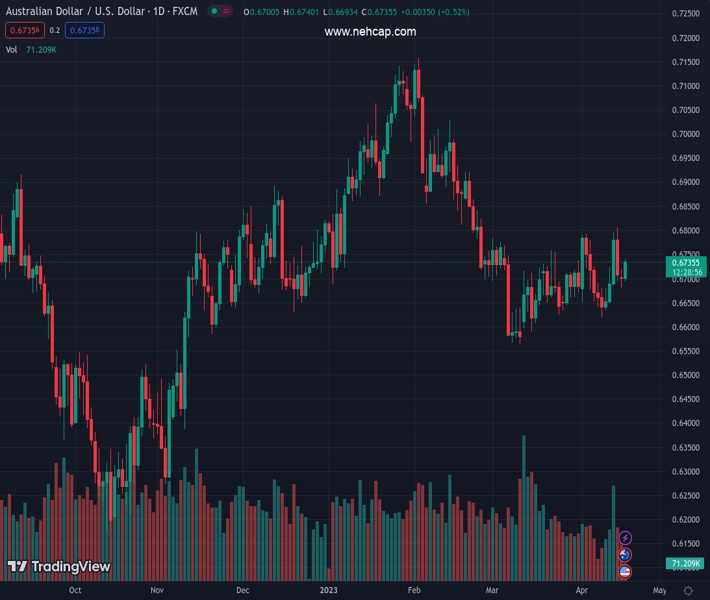
#AUDUSD @ 0.67341 regains positive traction on Tuesday and draws support from a combination of factors. (Pivot Orderbook analysis)
…
This is a premium post.
[s2If !current_user_can(access_s2member_level4)]Please register for PREMIUM VERSION HERE to read full post below containing analysis. In case of any error or you think you are not able to read the full post below, please email us at support#nehcap.com [lwa][/s2If] [s2If current_user_can(access_s2member_level4)]
- AUD/USD regains positive traction on Tuesday and draws support from a combination of factors.
- A hawkish tone from the RBA minutes and the upbeat Chinese data boost the Australian Dollar.
- A positive risk tone undermines the safe-haven USD and further benefits the risk-sensitive Aussie.
- Rising US bond yields could limit the USD losses and keep a lid on any further gains for the major.
The pair currently trades last at 0.67341.
The previous day high was 0.6719 while the previous day low was 0.6681. The daily 38.2% Fib levels comes at 0.6696, expected to provide support. Similarly, the daily 61.8% fib level is at 0.6705, expected to provide support.
The AUD/USD pair catches fresh bids following the previous day’s two-way directionless price move and maintains its bid tone through the early part of the European session on Tuesday. The pair currently trades around the 0.6735-0.6740 area, up nearly 0.60% for the day, and draws support from a combination of factors.
The hawkish tone from the Reserve Bank of Australia’s (RBA) minutes of the April meeting, along with the upbeat China macro data, underpin the Australian Dollar amid the emergence of some US Dollar selling. In fact, the RBA meeting minutes showed that board members considered the case for another 25 bps rate hike in April as inflation remained too high and the labour market was very tight. Meanwhile, data released on Tuesday showed that the Chinese economy grew 4.5% during the January-March quarter, well above estimates and the 2.9% in the previous quarter.
Adding to this, Industrial Production rose 3.9% in March, up from 2.4% in February, while Retail sales rose more than expected, by 10.6% last month. Furthermore, Fixed Asset Investment grew 5.1% in March Vs 5.5% in February, which, in turn, fueled optimism about the post-COVID recovery in the world’s second-largest economy and eased fears about a deeper global economic downturn. This remains supportive of a generally positive tone around the equity markets, which attracts fresh selling around the safe-haven US Dollar (USD) and further benefits the risk-sensitive Aussie.
That said, speculations that the Federal Reserve (Fed) will continue raising interest rates could limit the downside for the buck and act as a headwind for the AUD/USD pair, at least for the time being. In fact, the markets are currently pricing in a greater chance of another 25 bps lift-off at the next FOMC policy meeting in May. This remains supportive of elevated US Treasury bond yields and supports prospects for the emergence of some dip-buying, warranting some caution before placing fresh bullish bets around the major and positioning for any further intraday appreciating move.
Market participants now look forward to the US housing market data – Building Permits and Housing Starts – for some impetus later during the early North American session. This, along with the US bond yields and the broader risk sentiment, will influence the USD price dynamics and allow traders to grab short-term opportunities around the AUD/USD pair.
Technical Levels: Supports and Resistances
AUDUSD currently trading at 0.6738 at the time of writing. Pair opened at 0.6701 and is trading with a change of 0.55 % .
| Overview | Overview.1 | |
|---|---|---|
| 0 | Today last price | 0.6738 |
| 1 | Today Daily Change | 0.0037 |
| 2 | Today Daily Change % | 0.5500 |
| 3 | Today daily open | 0.6701 |
The pair is trading above its 20 Daily moving average @ 0.6695, below its 50 Daily moving average @ 0.6744 , below its 100 Daily moving average @ 0.68 and below its 200 Daily moving average @ 0.6744
| Trends | Trends.1 | |
|---|---|---|
| 0 | Daily SMA20 | 0.6695 |
| 1 | Daily SMA50 | 0.6744 |
| 2 | Daily SMA100 | 0.6800 |
| 3 | Daily SMA200 | 0.6744 |
The previous day high was 0.6719 while the previous day low was 0.6681. The daily 38.2% Fib levels comes at 0.6696, expected to provide support. Similarly, the daily 61.8% fib level is at 0.6705, expected to provide support.
Note the levels of interest below:
- Pivot support is noted at 0.6682, 0.6662, 0.6644
- Pivot resistance is noted at 0.672, 0.6739, 0.6758
| Levels | Levels.1 |
|---|---|
| Previous Daily High | 0.6719 |
| Previous Daily Low | 0.6681 |
| Previous Weekly High | 0.6806 |
| Previous Weekly Low | 0.6620 |
| Previous Monthly High | 0.6784 |
| Previous Monthly Low | 0.6564 |
| Daily Fibonacci 38.2% | 0.6696 |
| Daily Fibonacci 61.8% | 0.6705 |
| Daily Pivot Point S1 | 0.6682 |
| Daily Pivot Point S2 | 0.6662 |
| Daily Pivot Point S3 | 0.6644 |
| Daily Pivot Point R1 | 0.6720 |
| Daily Pivot Point R2 | 0.6739 |
| Daily Pivot Point R3 | 0.6758 |
[/s2If]
Join Our Telegram Group
")


