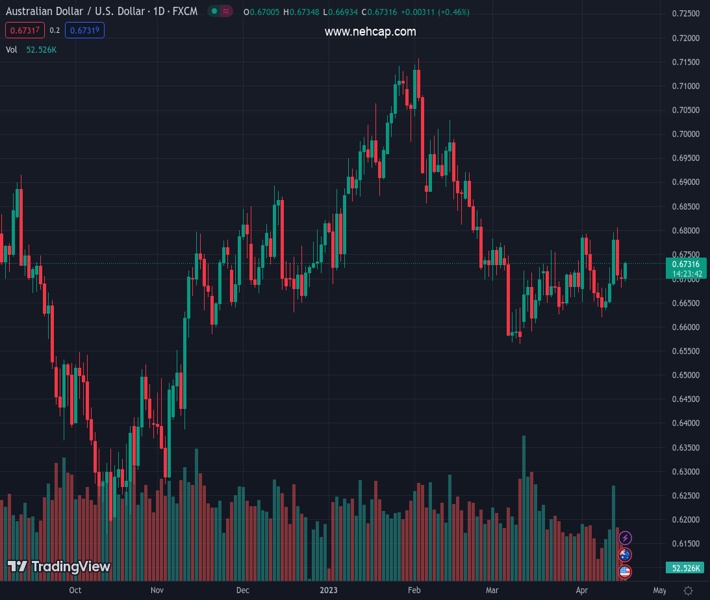
#AUDUSD @ 0.67324 climbed above 0.6720 after a decent recovery backed by mildly-hawkish RBA minutes. (Pivot Orderbook analysis)
…
This is a premium post.
[s2If !current_user_can(access_s2member_level4)]Please register for PREMIUM VERSION HERE to read full post below containing analysis. In case of any error or you think you are not able to read the full post below, please email us at support#nehcap.com [lwa][/s2If] [s2If current_user_can(access_s2member_level4)]
- AUD/USD climbed above 0.6720 after a decent recovery backed by mildly-hawkish RBA minutes.
- RBA policymakers were actively considering a continuation of a rate hike before keeping rates steady.
- The Aussie asset has been juggling between the 50% and 61.8% Fibonacci retracements.
The pair currently trades last at 0.67324.
The previous day high was 0.6719 while the previous day low was 0.6681. The daily 38.2% Fib levels comes at 0.6696, expected to provide support. Similarly, the daily 61.8% fib level is at 0.6705, expected to provide support.
The AUD/USD pair has stretched its recovery above 0.6720 in the early European session. The recovery in the Aussie asset is backed by mildly-hawkish Reserve Bank of Australia (RBA) minutes and a minimal correction in the US Dollar Index (DXY).
The USD Index has corrected to near 102.00 after a stellar recovery. The upside bias in the USD Index has not faded yet amid supportive fundamentals.
A scrutiny of RBA minutes showed that policymakers were actively considering a continuation of the rate hike but later settled on keeping rates steady at 3.6% to allow time to gather more information.
AUD/USD has shown a stellar recovery after building a strong base inside the 50% and the 61.8% Fibonacci retracements, which are placed at 0.6713 and 0.6690 respectively. The Fibonacci retracement is plotted from April 10 low at 0.6620 to April 14 high at 0.6806.
The Aussie asset has comfortably established above the 20-period Exponential Moving Average (EMA) at 0.6708, which indicates that the short-term trend is bullish.
After a range shift move from the bearish territory of 20.00-40.00 to the neutral range of 40.00-60.00, the Relative Strength Index (RSI) (14) is making efforts to climb above the 60.00 hurdle.
Going forward, a break above March 22 high at 0.6759 will drive the asset toward April 03 high at 0.6693. A breach above the latter would further drive the asset to February 06 low at 0.6855.
In an alternative scenario, more weakness will be observed on a breakdown of April 10 low at 0.6620, which will expose the Aussie asset to March 10 low at 0.6564 followed by the round-level support at 0.6500.
Technical Levels: Supports and Resistances
AUDUSD currently trading at 0.6722 at the time of writing. Pair opened at 0.6701 and is trading with a change of 0.31 % .
| Overview | Overview.1 | |
|---|---|---|
| 0 | Today last price | 0.6722 |
| 1 | Today Daily Change | 0.0021 |
| 2 | Today Daily Change % | 0.3100 |
| 3 | Today daily open | 0.6701 |
The pair is trading above its 20 Daily moving average @ 0.6695, below its 50 Daily moving average @ 0.6744 , below its 100 Daily moving average @ 0.68 and below its 200 Daily moving average @ 0.6744
| Trends | Trends.1 | |
|---|---|---|
| 0 | Daily SMA20 | 0.6695 |
| 1 | Daily SMA50 | 0.6744 |
| 2 | Daily SMA100 | 0.6800 |
| 3 | Daily SMA200 | 0.6744 |
The previous day high was 0.6719 while the previous day low was 0.6681. The daily 38.2% Fib levels comes at 0.6696, expected to provide support. Similarly, the daily 61.8% fib level is at 0.6705, expected to provide support.
Note the levels of interest below:
- Pivot support is noted at 0.6682, 0.6662, 0.6644
- Pivot resistance is noted at 0.672, 0.6739, 0.6758
| Levels | Levels.1 |
|---|---|
| Previous Daily High | 0.6719 |
| Previous Daily Low | 0.6681 |
| Previous Weekly High | 0.6806 |
| Previous Weekly Low | 0.6620 |
| Previous Monthly High | 0.6784 |
| Previous Monthly Low | 0.6564 |
| Daily Fibonacci 38.2% | 0.6696 |
| Daily Fibonacci 61.8% | 0.6705 |
| Daily Pivot Point S1 | 0.6682 |
| Daily Pivot Point S2 | 0.6662 |
| Daily Pivot Point S3 | 0.6644 |
| Daily Pivot Point R1 | 0.6720 |
| Daily Pivot Point R2 | 0.6739 |
| Daily Pivot Point R3 | 0.6758 |
[/s2If]
Join Our Telegram Group
")


