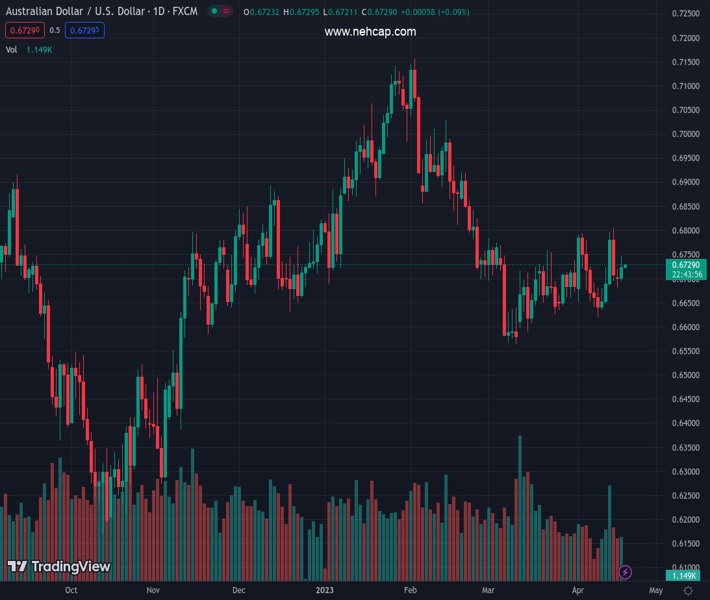
#AUDUSD @ 0.67293 seesaws in a choppy range after snapping two-day downtrend the previous day. (Pivot Orderbook analysis)
…
This is a premium post.
[s2If !current_user_can(access_s2member_level4)]Please register for PREMIUM VERSION HERE to read full post below containing analysis. In case of any error or you think you are not able to read the full post below, please email us at support#nehcap.com [lwa][/s2If] [s2If current_user_can(access_s2member_level4)]
- AUD/USD seesaws in a choppy range after snapping two-day downtrend the previous day.
- Slightly hawkish RBA Minutes, downbeat US data and firmer China statistics allowed Aussie buyers to return.
- Risk catalysts eyed for immediate directions amid a light calendar at home.
The pair currently trades last at 0.67293.
The previous day high was 0.6719 while the previous day low was 0.6681. The daily 38.2% Fib levels comes at 0.6696, expected to provide support. Similarly, the daily 61.8% fib level is at 0.6705, expected to provide support.
AUD/USD struggles to cheer the first daily gain in three as the quote dribbles around 0.6725-20 amid early Wednesday morning in Asia. In doing so, the Aussie pair seeks fresh clues to defend the previous day’s upbeat performance, mainly led by the Reserve Bank of Australia (RBA) Monetary Policy Meeting Minutes, China data dump and downbeat US housing market statistics.
That said, RBA Minutes appear slightly hawkish as it said that the board considered a rate hike at the April meeting, before deciding to pause.
On the other hand, China’s Q1 GDP grows 2.2% QoQ versus 2.2% expected and 0.0% prior. Further, Retail Sales growth jumps 10.9% YoY in March versus 7.4% expected and 3.5% prior whereas Industrial Production eased below 4.0% expected growth figures to 3.9%, versus 2.4% previous readings. Further, the International Monetary Fund (IMF) said in its latest report on Tuesday, China will be the top contributor to global growth over the next five years, with its share set to be doubled that of the US, per Bloomberg.
Elsewhere, after witnessing upbeat prints of the NY Empire State Manufacturing Index and the US National Association of Home Builders (NAHB) housing market index on Monday, the US Housing Starts and Building Permits roiled the mood with downbeat prints for March on Tuesday. That said, the Housing Starts eased to 1.42M versus 1.432M prior and 1.40M market forecasts whereas the Building Permits dropped to 1.413M from 1.55M previous readings and analysts’ estimations of 2.2M.
It should be noted that the hawkish Fed talks couldn’t save the US Dollar of late as St. Louis Federal Reserve President James Bullard said, in an interview with Reuters, “Interest rates will need to continue to rise in the absence of clear progress on inflation.” On Monday, Richmond Fed President Thomas Barkin said that he wants to see more evidence of inflation settling back to target.
Amid these plays, US Treasury bond yields retreat while Wall Street closed mixed.
Moving on, a light calendar in the Asia-Pacific region could restrict immediate moves, which in turn highlights risk catalysts as the key factors to watch for clear directions.
AUD/USD rebounds from a 21-DMA inside a six-week-old rising trend channel, suggesting a gradual recovery in Aussie prices.
Technical Levels: Supports and Resistances
AUDUSD currently trading at 0.6727 at the time of writing. Pair opened at 0.6701 and is trading with a change of 0.39% % .
| Overview | Overview.1 | |
|---|---|---|
| 0 | Today last price | 0.6727 |
| 1 | Today Daily Change | 0.0026 |
| 2 | Today Daily Change % | 0.39% |
| 3 | Today daily open | 0.6701 |
The pair is trading above its 20 Daily moving average @ 0.6695, below its 50 Daily moving average @ 0.6744 , below its 100 Daily moving average @ 0.68 and below its 200 Daily moving average @ 0.6744
| Trends | Trends.1 | |
|---|---|---|
| 0 | Daily SMA20 | 0.6695 |
| 1 | Daily SMA50 | 0.6744 |
| 2 | Daily SMA100 | 0.6800 |
| 3 | Daily SMA200 | 0.6744 |
The previous day high was 0.6719 while the previous day low was 0.6681. The daily 38.2% Fib levels comes at 0.6696, expected to provide support. Similarly, the daily 61.8% fib level is at 0.6705, expected to provide support.
Note the levels of interest below:
- Pivot support is noted at 0.6682, 0.6662, 0.6644
- Pivot resistance is noted at 0.672, 0.6739, 0.6758
| Levels | Levels.1 |
|---|---|
| Previous Daily High | 0.6719 |
| Previous Daily Low | 0.6681 |
| Previous Weekly High | 0.6806 |
| Previous Weekly Low | 0.6620 |
| Previous Monthly High | 0.6784 |
| Previous Monthly Low | 0.6564 |
| Daily Fibonacci 38.2% | 0.6696 |
| Daily Fibonacci 61.8% | 0.6705 |
| Daily Pivot Point S1 | 0.6682 |
| Daily Pivot Point S2 | 0.6662 |
| Daily Pivot Point S3 | 0.6644 |
| Daily Pivot Point R1 | 0.6720 |
| Daily Pivot Point R2 | 0.6739 |
| Daily Pivot Point R3 | 0.6758 |
[/s2If]
Join Our Telegram Group
")


