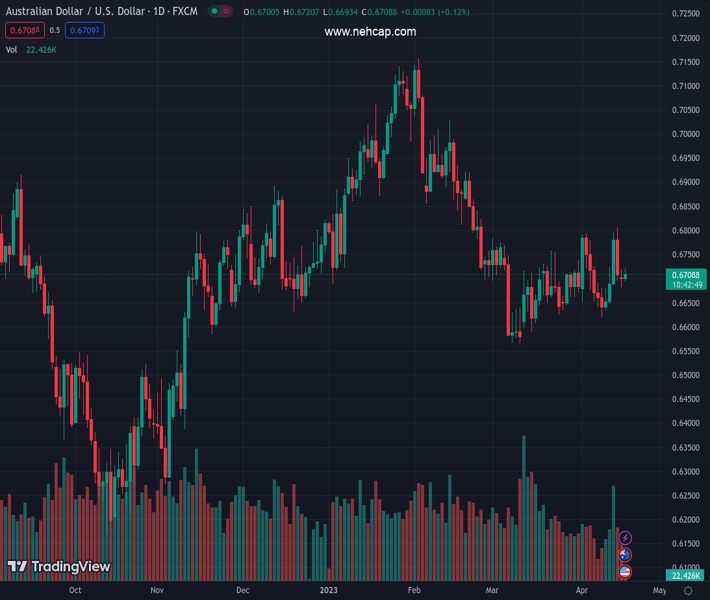
#AUDUSD @ 0.67089 initially refreshed intraday high before recently easing from the top. (Pivot Orderbook analysis)
…
This is a premium post.
[s2If !current_user_can(access_s2member_level4)]Please register for PREMIUM VERSION HERE to read full post below containing analysis. In case of any error or you think you are not able to read the full post below, please email us at support#nehcap.com [lwa][/s2If] [s2If current_user_can(access_s2member_level4)]
- AUD/USD initially refreshed intraday high before recently easing from the top.
- RBA Minutes fail to convince market players of policymakers’ hawkish capacity.
- China data dump portrays solid economic transition of Australia’s biggest customer.
- Sluggish markets, hawkish Fed bets exert additional downside pressure on AUD/USD price.
The pair currently trades last at 0.67089.
The previous day high was 0.6719 while the previous day low was 0.6681. The daily 38.2% Fib levels comes at 0.6696, expected to provide support. Similarly, the daily 61.8% fib level is at 0.6705, expected to provide support.
AUD/USD pares the first daily gains in three around 0.6710, after an initial jump to 0.6720, as strong China growth data joins RBA Minutes-led optimism during early Tuesday.
That said, China’s Q1 GDP grows 2.2% QoQ versus 2.2% expected and 0.0% prior. Further, Retail Sales growth jumps 10.9% YoY in March versus 7.4% expected and 3.5% prior whereas Industrial Production eased below 4.0% expected growth figures to 3.9%, versus 2.4% previous readings.
Earlier in the day, the latest Reserve Bank of Australia (RBA) Monetary Policy Meeting Minutes appear slightly hawkish as it said that the board considered a rate hike at the April meeting, before deciding to pause.
Also read: RBA minutes: Australia’s central bank actively considered April rate hike before deciding on pause
Apart from the China Q1 GDP and RBA Minutes, the hawkish Fed bets seem to also play a role in directing short-term AUD/USD moves.
That said, Monday’s upbeat US data followed Friday’s upbeat consumer-centric statistics and propelled the market’s bets on the 0.25% Fed rate hike in May, as well as cut the odds of a rate reduction from the US central bank sometime in late 2023. Not only the data but Fed talks and upbeat yields also favored the hawkish Fed bets and favored the US Dollar, which in turn weighed on the AUD/USD prices.
On Monday, the NY Empire State Manufacturing Index jumped to 10.8 for April while snapping the four-month downtrend, as well marking the highest level since July last year. Further, the US National Association of Home Builders (NAHB) housing market index also rose for the fourth consecutive month in April to 45, versus 44 expected and prior reading. Following the data, Richmond Fed President Thomas Barkin said on Monday that he wants to see more evidence of inflation settling back to target. The policymaker also added that he feels reassured by what he is seeing in the banking sector.
Amid these plays, S&P 500 Futures remain directionless while Australia’s ASX 200 prints a 0.30% intraday loss by the press time.
Having witnessed the initial market reaction to the RBA Minutes, AUD/USD traders await China’s Q1 GDP, expected 2.2% QoQ versus 0.0% prior, for fresh impulse. Should the Chinese growth numbers fail to match the market’s high expectations, the Aussie pair may print further losses. Following that, the US Housing Starts and Building Permits for March will join Fed talks to entertain the traders.
Although the 21-SMA and 200-SMA, respectively near 0.6730 and 0.6685, restrict the AUD/USDD pair’s immediate moves, bearish MACD signals and a steady RSI (14) line hint at the continuation of the pair’s downward trajectory.
Technical Levels: Supports and Resistances
AUDUSD currently trading at 0.671 at the time of writing. Pair opened at 0.6701 and is trading with a change of 0.13 % .
| Overview | Overview.1 | |
|---|---|---|
| 0 | Today last price | 0.6710 |
| 1 | Today Daily Change | 0.0009 |
| 2 | Today Daily Change % | 0.1300 |
| 3 | Today daily open | 0.6701 |
The pair is trading above its 20 Daily moving average @ 0.6695, below its 50 Daily moving average @ 0.6744 , below its 100 Daily moving average @ 0.68 and below its 200 Daily moving average @ 0.6744
| Trends | Trends.1 | |
|---|---|---|
| 0 | Daily SMA20 | 0.6695 |
| 1 | Daily SMA50 | 0.6744 |
| 2 | Daily SMA100 | 0.6800 |
| 3 | Daily SMA200 | 0.6744 |
The previous day high was 0.6719 while the previous day low was 0.6681. The daily 38.2% Fib levels comes at 0.6696, expected to provide support. Similarly, the daily 61.8% fib level is at 0.6705, expected to provide support.
Note the levels of interest below:
- Pivot support is noted at 0.6682, 0.6662, 0.6644
- Pivot resistance is noted at 0.672, 0.6739, 0.6758
| Levels | Levels.1 |
|---|---|
| Previous Daily High | 0.6719 |
| Previous Daily Low | 0.6681 |
| Previous Weekly High | 0.6806 |
| Previous Weekly Low | 0.6620 |
| Previous Monthly High | 0.6784 |
| Previous Monthly Low | 0.6564 |
| Daily Fibonacci 38.2% | 0.6696 |
| Daily Fibonacci 61.8% | 0.6705 |
| Daily Pivot Point S1 | 0.6682 |
| Daily Pivot Point S2 | 0.6662 |
| Daily Pivot Point S3 | 0.6644 |
| Daily Pivot Point R1 | 0.6720 |
| Daily Pivot Point R2 | 0.6739 |
| Daily Pivot Point R3 | 0.6758 |
[/s2If]
Join Our Telegram Group
")


