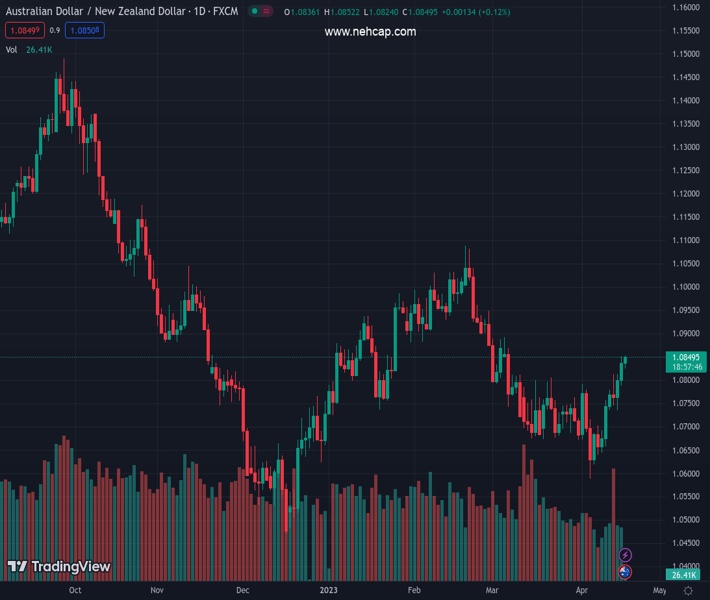
#AUDNZD @ 1.08484 picks up bids to reverse the early losses on RBA Minutes. (Pivot Orderbook analysis)
…
This is a premium post.
[s2If !current_user_can(access_s2member_level4)]Please register for PREMIUM VERSION HERE to read full post below containing analysis. In case of any error or you think you are not able to read the full post below, please email us at support#nehcap.com [lwa][/s2If] [s2If current_user_can(access_s2member_level4)]
- AUD/NZD picks up bids to reverse the early losses on RBA Minutes.
- RBA Minutes appear slightly hawkish while justifying the pause in rate hike trajectory.
- China Q1 GDP, risk catalysts and New Zealand’s quarterly inflation data are the key for clear directions.
The pair currently trades last at 1.08484.
The previous day high was 1.085 while the previous day low was 1.0796. The daily 38.2% Fib levels comes at 1.0829, expected to provide support. Similarly, the daily 61.8% fib level is at 1.0816, expected to provide support.
AUD/NZD cheers upbeat statements from the latest Reserve Bank of Australia (RBA) Monetary Policy Meeting Minutes during early Tuesday, picking up bids to refresh intraday high near 1.0850 at the latest. In doing so, the exotic pair reverses the initial losses, the first in the seven days, to rejoin the bullish run.
The latest RBA Minutes appear hawkish as it said that the board considered a rate hike at the April meeting, before deciding to pause.
Also read: RBA minutes: Australia’s central bank actively considered April rate hike before deciding on pause
Apart from the RBA Minutes, the cautious optimism in the market, head of the key China data and amid receding fears of recession, also underpin the AUD/NZD pair’s latest run-up. That said, the recent comments from the International Monetary Fund (IMF) about China’s economic growth seems to underpin the AUD/NZD run-up.
“In its latest World Economic Outlook, the IMF forecasts that China’s economic growth contribution will be nearly double that of India and the US. India is forecast to deliver 12.9% of global growth while the US is forecast to deliver 11.3% of the growth,” per analysts at ANZ.
While portraying the mood, S&P 500 Futures remain directionless while Australia’s ASX 200 prints a 0.30% intraday loss by the press time.
That said, the initial market reaction to the RBA Minutes appears impressive. However, the AUD/NZD pair traders should rely on the China Q1 GDP, expected 2.2% QoQ versus 0.0% prior, for clear directions. Above all, Thursday’s New Zealand Q1 Consumer Price Index (CPI), expected to rise to 2.0% QoQ versus 1.4% prior, will be crucial for the exotic pair traders to watch for clear directions.
The MACD indicator flashes bullish MACD signals whereas the RSI (14) line grinds higher past the 50 level, not overbought, which in turn suggests further advances of the AUD/NZD pair unless it drops below a fortnight-old ascending support line, close to 1.0770 by the press time.
Also read: AUD/NZD Price Analysis: Retreats below 1.0860-70 key hurdle ahead of RBA Minutes, China Q1 GDP
Technical Levels: Supports and Resistances
AUDNZD currently trading at 1.084 at the time of writing. Pair opened at 1.0841 and is trading with a change of -0.01% % .
| Overview | Overview.1 | |
|---|---|---|
| 0 | Today last price | 1.084 |
| 1 | Today Daily Change | -0.0001 |
| 2 | Today Daily Change % | -0.01% |
| 3 | Today daily open | 1.0841 |
The pair is trading above its 20 Daily moving average @ 1.0729, above its 50 Daily moving average @ 1.0819 , above its 100 Daily moving average @ 1.0789 and below its 200 Daily moving average @ 1.095
| Trends | Trends.1 | |
|---|---|---|
| 0 | Daily SMA20 | 1.0729 |
| 1 | Daily SMA50 | 1.0819 |
| 2 | Daily SMA100 | 1.0789 |
| 3 | Daily SMA200 | 1.0950 |
The previous day high was 1.085 while the previous day low was 1.0796. The daily 38.2% Fib levels comes at 1.0829, expected to provide support. Similarly, the daily 61.8% fib level is at 1.0816, expected to provide support.
Note the levels of interest below:
- Pivot support is noted at 1.0808, 1.0774, 1.0753
- Pivot resistance is noted at 1.0862, 1.0883, 1.0916
| Levels | Levels.1 |
|---|---|
| Previous Daily High | 1.0850 |
| Previous Daily Low | 1.0796 |
| Previous Weekly High | 1.0813 |
| Previous Weekly Low | 1.0647 |
| Previous Monthly High | 1.0892 |
| Previous Monthly Low | 1.0672 |
| Daily Fibonacci 38.2% | 1.0829 |
| Daily Fibonacci 61.8% | 1.0816 |
| Daily Pivot Point S1 | 1.0808 |
| Daily Pivot Point S2 | 1.0774 |
| Daily Pivot Point S3 | 1.0753 |
| Daily Pivot Point R1 | 1.0862 |
| Daily Pivot Point R2 | 1.0883 |
| Daily Pivot Point R3 | 1.0916 |
[/s2If]
Join Our Telegram Group
")


