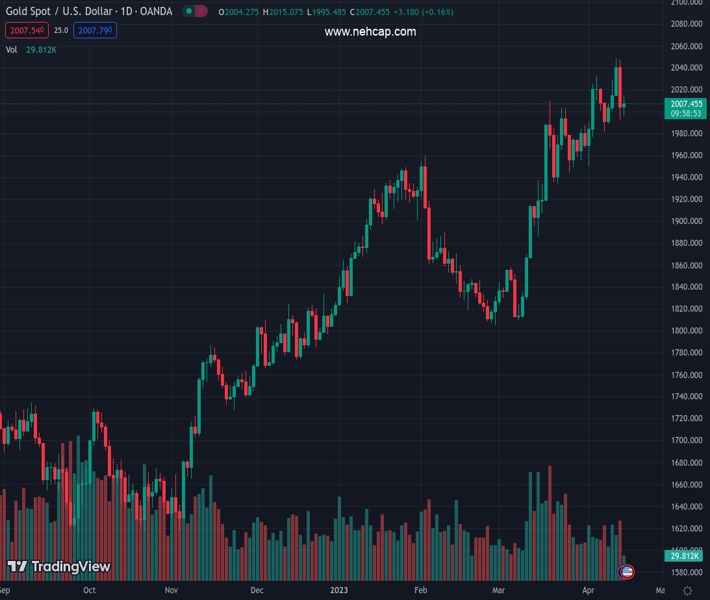
#XAUUSD @ 2,007.58 Gold price regains positive traction on Monday, though the uptick lacks bullish conviction. (Pivot Orderbook analysis)
…
This is a premium post.
[s2If !current_user_can(access_s2member_level4)]Please register for PREMIUM VERSION HERE to read full post below containing analysis. In case of any error or you think you are not able to read the full post below, please email us at support#nehcap.com [lwa][/s2If] [s2If current_user_can(access_s2member_level4)]
- Gold price regains positive traction on Monday, though the uptick lacks bullish conviction.
- Looming recession fears turn out to be a key factor benefitting the safe-haven commodity.
- A modest US Dollar strength holds back bulls from placing fresh bets and caps the upside.
The pair currently trades last at 2007.58.
The previous day high was 2047.49 while the previous day low was 1992.45. The daily 38.2% Fib levels comes at 2013.48, expected to provide resistance. Similarly, the daily 61.8% fib level is at 2026.46, expected to provide resistance.
Gold price attracts fresh buying near the $1,995 area on the first day of a new week and maintains its bid tone through the first half of the European session. The XAU/USD is currently placed around the $2,010-$2,011 region, up over 0.40% for the day, and for now, seems to have stalled Friday’s retracement slide from the vicinity of over a one-year peak.
Growing worries about a deeper global economic downturn turns out to be a key factor lending some support to the safe-haven Gold price amid expectations for an imminent pause in the rate-hiking cycle by the Federal Reserve (Fed). That said, impressive bank earnings seem to have eased fears about a banking crisis that unfolded in March. Adding to this, the Retail Sales report released from the United States (US) on Friday suggested that the economy is not so bad and remained supportive of a generally positive tone around the equity markets. This, along with a modest US Dollar (USD) strength, is holding back bulls traders from placing aggressive bets around the XAU/USD and capping the upside, at least for the time being.
Despite the softer US consumer inflation and the Producer Price Index released last week, Fed Governor Christopher Waller on Friday called for further rate hikes and said that the job was still not done as inflation remains far too high. The markets were quick to react and are now pricing in a greater chance of another 25 basis point (bps) lift-off at the next Federal Open Market Committee (FOMC) policy meeting in May. This remains supportive of elevated US Treasury bond yields, which, in turn, assists the USD to build on Friday’s goodish rebound from a one-year low and gain follow-through traction for the second successive day. A stronger Greenback tends to undermine demand for the US Dollar-denominated Gold price.
The aforementioned mixed fundamental backdrop warrants some caution before positioning for any further appreciating move for the XAU/USD. Nevertheless, Gold price manages to hold above the $2,000 psychological mark as traders now look to the US economic docket, featuring the release of the Empire State Manufacturing Index for a fresh impetus later during the early North American session. Apart from this, the US bond yields will influence the USD price dynamics, which, along with the broader risk sentiment, should contribute to producing short-term opportunities around the XAU/USD.
From a technical perspective, the emergence of fresh buying on Monday favours bullish traders and support prospects for an extension of the recent strong upward trajectory witnessed over the past month or so. That said, sustained weakness below the $1,995-$1,990 region, will negate the positive outlook and prompt some technical selling. The Gold price might then accelerate the corrective decline towards the $1,965-$1,960 intermediate support en route to the $1,950 horizontal zone.
On the flip side, bulls might now wait for some follow-through buying beyond the $2,020 area before placing fresh bets. The Gold price might then climb to the YTD peak, around the $2,047-$2,049 region touched last Thursday. The subsequent move up has the potential to lift the XAU/USD back towards retesting the all-time high, around the $2,070-$2,075 region touched in August 2020.
Technical Levels: Supports and Resistances
XAUUSD currently trading at 2007.87 at the time of writing. Pair opened at 2004.2 and is trading with a change of 0.18 % .
| Overview | Overview.1 | |
|---|---|---|
| 0 | Today last price | 2007.87 |
| 1 | Today Daily Change | 3.67 |
| 2 | Today Daily Change % | 0.18 |
| 3 | Today daily open | 2004.20 |
The pair remains strongly bullish on the daily timeframe. It trades above its 20 SMA @ 1989.11, 50 SMA 1907.04, 100 SMA @ 1875.45 and 200 SMA @ 1793.7.
| Trends | Trends.1 | |
|---|---|---|
| 0 | Daily SMA20 | 1989.11 |
| 1 | Daily SMA50 | 1907.04 |
| 2 | Daily SMA100 | 1875.45 |
| 3 | Daily SMA200 | 1793.70 |
The previous day high was 2047.49 while the previous day low was 1992.45. The daily 38.2% Fib levels comes at 2013.48, expected to provide resistance. Similarly, the daily 61.8% fib level is at 2026.46, expected to provide resistance.
Note the levels of interest below:
- Pivot support is noted at 1981.94, 1959.67, 1926.9
- Pivot resistance is noted at 2036.98, 2069.75, 2092.02
| Levels | Levels.1 |
|---|---|
| Previous Daily High | 2047.49 |
| Previous Daily Low | 1992.45 |
| Previous Weekly High | 2048.75 |
| Previous Weekly Low | 1986.28 |
| Previous Monthly High | 2009.88 |
| Previous Monthly Low | 1809.46 |
| Daily Fibonacci 38.2% | 2013.48 |
| Daily Fibonacci 61.8% | 2026.46 |
| Daily Pivot Point S1 | 1981.94 |
| Daily Pivot Point S2 | 1959.67 |
| Daily Pivot Point S3 | 1926.90 |
| Daily Pivot Point R1 | 2036.98 |
| Daily Pivot Point R2 | 2069.75 |
| Daily Pivot Point R3 | 2092.02 |
[/s2If]
Join Our Telegram Group
")


