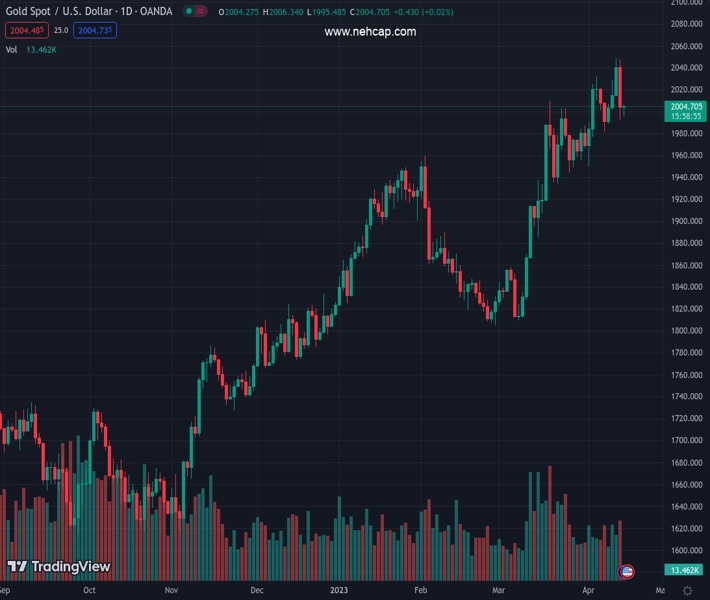
#XAUUSD @ 2,004.40 Gold price remains indecisive after luring bears the previous day., @nehcap view: Pullback expected (Pivot Orderbook analysis)
…
This is a premium post.
[s2If !current_user_can(access_s2member_level4)]Please register for PREMIUM VERSION HERE to read full post below containing analysis. In case of any error or you think you are not able to read the full post below, please email us at support#nehcap.com [lwa][/s2If] [s2If current_user_can(access_s2member_level4)]
- Gold price remains indecisive after luring bears the previous day.
- US Dollar tracks Treasury bond yields amid mixed concerns about recession, US debt ceiling talks.
- China-linked headlines, light calendar adds strength to the XAU/USD inaction.
- US PMIs, central bank talks will be important to watch for clear directions.
The pair currently trades last at 2004.40.
The previous day high was 2047.49 while the previous day low was 1992.45. The daily 38.2% Fib levels comes at 2013.48, expected to provide resistance. Similarly, the daily 61.8% fib level is at 2026.46, expected to provide resistance.
Gold price (XAU/USD) seesaws around $2,005 as it struggles for clear directions amid sluggish trading early Monday morning in Europe.
The bright metal marked the first daily loss in four the previous day, as well as posted the biggest daily loss in three weeks, as the US Dollar posted a corrective bounce off a one-year low. Adding strength to the XAU/USD inaction could be the mixed catalyst surrounding the US Federal Reserve (Fed) and the geopolitical fears amid a light calendar for the day, as well as for the week.
That said, a wider-than-expected fall in US Retail Sales failed to supersede upbeat figures from the US Industrial Production and University of Michigan’s (UoM) Consumer Confidence Index and allowed the US Dollar to rebound. Not only the data but hawkish comments from the Fed policymakers also enabled the greenback to pare the previous losses. Amid these plays, the CME’s FedWatch tool suggests an almost certain case of the US central bank’s 0.25% rate hike in May. That said, the interest rate futures also tame the odds of the rate cuts in late 2023, as well as support the longer halt to the rate hike trajectory after the upcoming rate lift.
On the contrary, fears surrounding China’s ties with Russia and the resulting geopolitical tension, as well as the recent retreat in the US Treasury bond yields weigh on the Gold price.
Amid these plays, the S&P 500 Futures print 0.20% intraday gains as it reverses the previous day’s pullback from the highest levels since early February around 4,172. That said, the US 10-year and two-year Treasury bond yields pare the previous week’s 3.0% gains with minor losses around 3.52%% and 4.11% respectively.
Looking forward, the Gold price may remain sluggish ahead of Tuesday’s China GDP, which in turn can allow the XAU/USD to witness a pullback in case of downbeat growth numbers from the world’s biggest Gold consumers. Following that, Friday’s preliminary readings of US PMIs for April will be important for clear directions.
Gold price consolidates the previous day’s downside break of a two-week-old support line, now resistance around $2,020, as it bounces off the 50% Fibonacci retracement level of the XAU/USD up-moves from March 22 to April 13, close to $1,991.
Adding strength to the recovery moves is the RSI (14) rebound from the oversold territory and the looming bull cross on the MACD indicator.
However, the 200-bar Exponential Moving Average (EMA), around $2,010 by the press time, guards the immediate upside of the Gold price ahead of the aforementioned support-turned-resistance near $2,020.
Following that, the early-month swing high around $2,033 and the monthly peak surrounding $2,049 can lure the XAU/USD bulls.
Meanwhile, a downside break of the 50% Fibonacci retracement level of $1,991 will need validation from the 61.8% Fibonacci retracement and a three-week-long ascending support line, respectively near $1,978 and $1,967, to convince the Gold bears.
Overall, Gold price struggles for clear directions but the buyers seem running out of fuel of late.
Trend: Pullback expected
Technical Levels: Supports and Resistances
XAUUSD currently trading at 2004.66 at the time of writing. Pair opened at 2004.2 and is trading with a change of 0.02% % .
| Overview | Overview.1 | |
|---|---|---|
| 0 | Today last price | 2004.66 |
| 1 | Today Daily Change | 0.46 |
| 2 | Today Daily Change % | 0.02% |
| 3 | Today daily open | 2004.2 |
The pair remains strongly bullish on the daily timeframe. It trades above its 20 SMA @ 1989.11, 50 SMA 1907.04, 100 SMA @ 1875.45 and 200 SMA @ 1793.7.
| Trends | Trends.1 | |
|---|---|---|
| 0 | Daily SMA20 | 1989.11 |
| 1 | Daily SMA50 | 1907.04 |
| 2 | Daily SMA100 | 1875.45 |
| 3 | Daily SMA200 | 1793.70 |
The previous day high was 2047.49 while the previous day low was 1992.45. The daily 38.2% Fib levels comes at 2013.48, expected to provide resistance. Similarly, the daily 61.8% fib level is at 2026.46, expected to provide resistance.
Note the levels of interest below:
- Pivot support is noted at 1981.94, 1959.67, 1926.9
- Pivot resistance is noted at 2036.98, 2069.75, 2092.02
| Levels | Levels.1 |
|---|---|
| Previous Daily High | 2047.49 |
| Previous Daily Low | 1992.45 |
| Previous Weekly High | 2048.75 |
| Previous Weekly Low | 1986.28 |
| Previous Monthly High | 2009.88 |
| Previous Monthly Low | 1809.46 |
| Daily Fibonacci 38.2% | 2013.48 |
| Daily Fibonacci 61.8% | 2026.46 |
| Daily Pivot Point S1 | 1981.94 |
| Daily Pivot Point S2 | 1959.67 |
| Daily Pivot Point S3 | 1926.90 |
| Daily Pivot Point R1 | 2036.98 |
| Daily Pivot Point R2 | 2069.75 |
| Daily Pivot Point R3 | 2092.02 |
[/s2If]
Join Our Telegram Group
")


