#XAGUSD @ 25.026 Silver price remains pressured after breaking one-month-old support line, down for the third consecutive day., @nehcap view: Further downside expected (Pivot Orderbook analysis)
…
This is a premium post.
[s2If !current_user_can(access_s2member_level4)]Please register for PREMIUM VERSION HERE to read full post below containing analysis. In case of any error or you think you are not able to read the full post below, please email us at support#nehcap.com [lwa][/s2If] [s2If current_user_can(access_s2member_level4)]
- Silver price remains pressured after breaking one-month-old support line, down for the third consecutive day.
- Looming bear cross on MACD adds strength to downside bias.
- Previous resistance line from early January challenges XAG/USD sellers before the 21-DMA support.
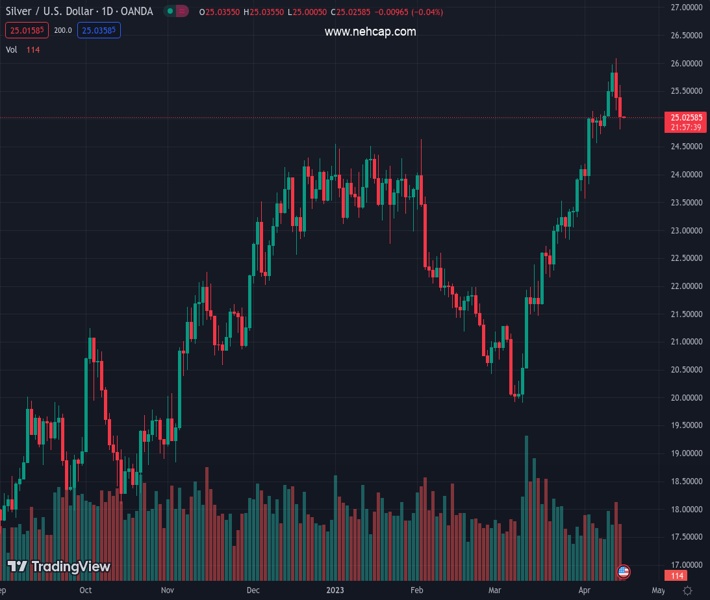
The pair currently trades last at 25.026.
The previous day high was 26.09 while the previous day low was 25.16. The daily 38.2% Fib levels comes at 25.51, expected to provide resistance. Similarly, the daily 61.8% fib level is at 25.73, expected to provide resistance.
Silver price (XAG/USD) remains pressured at the $25.00 threshold, down for the third consecutive day during early Tuesday in Asia.
In doing so, the bright metal justifies the previous day’s downside break of a one-month-old ascending support line, now immediate resistance, while extending the pullback from a one-year high marked in the last week.
Apart from the trend line breakdown, an impending bear cross on the MACD indicator also keeps the XAG/USD sellers hopeful.
However, a resistance-turned-support line from early January, close to $24.85 by the press time, challenges the Silver bears at the latest.
Following that, tops marked in February and January, around $24.65 and $24.55 respectively, could challenge the XAG/USD bears before directing them to the 21-DMA support of around $24.15.
In a case where the Silver price remains bearish past $24.15, the odds of witnessing a slump toward March’s high of nearly $23.50 can’t be ruled out.
On the flip side, Silver price recovery needs validation from the previous support line from mid-March, close to $25.25 at the latest.
Should the commodity manages to remain firmer past $25.25, the late 2021 high near $25.40 and the latest peak of near $26.10 can act as extra checks for the XAG/USD bulls to cross before eyeing the April 2022 high of $26.22 and the last years high of $26.95.
Trend: Further downside expected
Technical Levels: Supports and Resistances
XAGUSD currently trading at 25.02 at the time of writing. Pair opened at 25.37 and is trading with a change of -1.38% % .
| Overview | Overview.1 | |
|---|---|---|
| 0 | Today last price | 25.02 |
| 1 | Today Daily Change | -0.35 |
| 2 | Today Daily Change % | -1.38% |
| 3 | Today daily open | 25.37 |
The pair remains strongly bullish on the daily timeframe. It trades above its 20 SMA @ 24.01, 50 SMA 22.45, 100 SMA @ 22.93 and 200 SMA @ 21.26.
| Trends | Trends.1 | |
|---|---|---|
| 0 | Daily SMA20 | 24.01 |
| 1 | Daily SMA50 | 22.45 |
| 2 | Daily SMA100 | 22.93 |
| 3 | Daily SMA200 | 21.26 |
The previous day high was 26.09 while the previous day low was 25.16. The daily 38.2% Fib levels comes at 25.51, expected to provide resistance. Similarly, the daily 61.8% fib level is at 25.73, expected to provide resistance.
Note the levels of interest below:
- Pivot support is noted at 24.99, 24.61, 24.06
- Pivot resistance is noted at 25.92, 26.47, 26.85
| Levels | Levels.1 |
|---|---|
| Previous Daily High | 26.09 |
| Previous Daily Low | 25.16 |
| Previous Weekly High | 26.09 |
| Previous Weekly Low | 24.72 |
| Previous Monthly High | 24.16 |
| Previous Monthly Low | 19.90 |
| Daily Fibonacci 38.2% | 25.51 |
| Daily Fibonacci 61.8% | 25.73 |
| Daily Pivot Point S1 | 24.99 |
| Daily Pivot Point S2 | 24.61 |
| Daily Pivot Point S3 | 24.06 |
| Daily Pivot Point R1 | 25.92 |
| Daily Pivot Point R2 | 26.47 |
| Daily Pivot Point R3 | 26.85 |
[/s2If]
Join Our Telegram Group
")


