WTI crude oil fails to cheer US Dollar retreat as it drops towards intraday low. (Pivot Orderbook analysis)
…
This is a premium post.
[s2If !current_user_can(access_s2member_level4)]Please register for PREMIUM VERSION HERE to read full post below containing analysis. In case of any error or you think you are not able to read the full post below, please email us at support#nehcap.com [lwa][/s2If] [s2If current_user_can(access_s2member_level4)]
- WTI crude oil fails to cheer US Dollar retreat as it drops towards intraday low.
- Concerns that higher Oil price, challenges to economic growth can recall WTI bears.
- China Q1 GDP, preliminary readings for April’s US PMIs will be in focus.
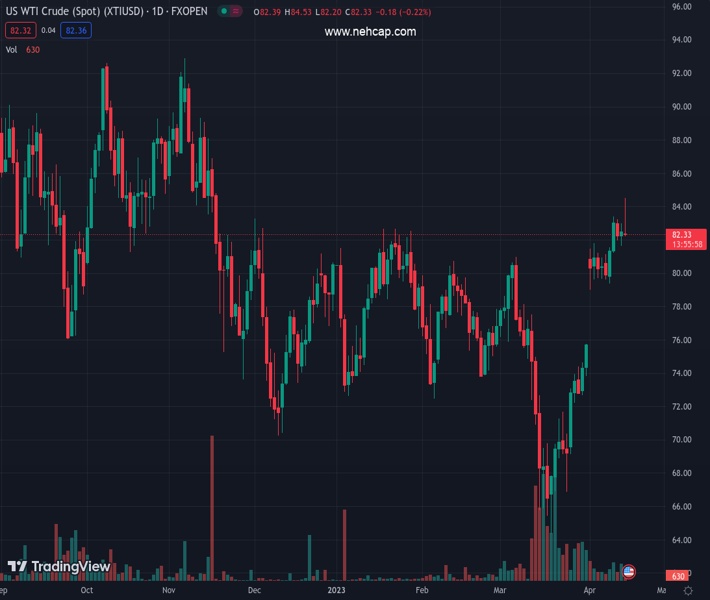
The pair currently trades last at 82.33.
The previous day high was 82.99 while the previous day low was 81.65. The daily 38.2% Fib levels comes at 82.48, expected to provide resistance. Similarly, the daily 61.8% fib level is at 82.16, expected to provide support.
WTI crude oil approaches intraday low, down 0.33% on a day around $82.30 by the press time, as energy buyers run out of steam after a four-week uptrend.
The black gold’s latest weakness ignores the US Dollar’s retreat amid fears of easing energy demand due to the challenges to the economic outlook. Also allowing the commodity price to pare recent gains is the cautious mood ahead of this week’s key data/events for the quote, namely the first readings of the US S&P Global Manufacturing and Non-Manufacturing PMI for April and China’s first quarter (Q1) Gross Domestic Product (GDP).
Statements from the International Energy Agency’s (IEA) monthly oil market report exert downside pressure on WTI crude oil. “Output cuts announced by OPEC+ producers risk exacerbating an oil supply deficit expected in the second half of the year and could hurt consumers and global economic recovery.”
On the same line could be doubts about the economic recovery in China, one of the world’s biggest Oil consumers. That said, the latest PMIs from the Dragon Nation haven’t been convincing enough to market expectations of a strong recovery of Beijing. Furthermore, the looming geopolitical crisis between the US and China also exerts downside pressure on black gold.
It should be noted that the recently firmer US consumer-centric figures and hawkish comments from the Fed officials pushed back the dovish bias from the US central bank and allowed the US Dollar to rebound from a one-year low, which in turn prods the Oil buyers.
Moving on, WTI crude oil buyers need to remain cautious ahead of China’s Q1 GDP and the US PMI. That said, the Oil bulls seem to run out of steam and hence any softer economics from any of the critical Oil consumers, namely the US and China, may recall the commodity sellers.
A daily closing below a one-month-old ascending support line, around $82.30 by the press time, becomes necessary for the WTI crude oil sellers to retake control.
Technical Levels: Supports and Resistances
XTIUSD currently trading at 82.33 at the time of writing. Pair opened at 82.6 and is trading with a change of -0.33% % .
| Overview | Overview.1 | |
|---|---|---|
| 0 | Today last price | 82.33 |
| 1 | Today Daily Change | -0.27 |
| 2 | Today Daily Change % | -0.33% |
| 3 | Today daily open | 82.6 |
The pair is trading above its 20 Daily moving average @ 75.69, above its 50 Daily moving average @ 76.14 , above its 100 Daily moving average @ 76.92 and below its 200 Daily moving average @ 82.59
| Trends | Trends.1 | |
|---|---|---|
| 0 | Daily SMA20 | 75.69 |
| 1 | Daily SMA50 | 76.14 |
| 2 | Daily SMA100 | 76.92 |
| 3 | Daily SMA200 | 82.59 |
The previous day high was 82.99 while the previous day low was 81.65. The daily 38.2% Fib levels comes at 82.48, expected to provide resistance. Similarly, the daily 61.8% fib level is at 82.16, expected to provide support.
Note the levels of interest below:
- Pivot support is noted at 81.83, 81.07, 80.49
- Pivot resistance is noted at 83.18, 83.76, 84.52
| Levels | Levels.1 |
|---|---|
| Previous Daily High | 82.99 |
| Previous Daily Low | 81.65 |
| Previous Weekly High | 83.40 |
| Previous Weekly Low | 79.40 |
| Previous Monthly High | 80.99 |
| Previous Monthly Low | 64.39 |
| Daily Fibonacci 38.2% | 82.48 |
| Daily Fibonacci 61.8% | 82.16 |
| Daily Pivot Point S1 | 81.83 |
| Daily Pivot Point S2 | 81.07 |
| Daily Pivot Point S3 | 80.49 |
| Daily Pivot Point R1 | 83.18 |
| Daily Pivot Point R2 | 83.76 |
| Daily Pivot Point R3 | 84.52 |
[/s2If]
Join Our Telegram Group
")


