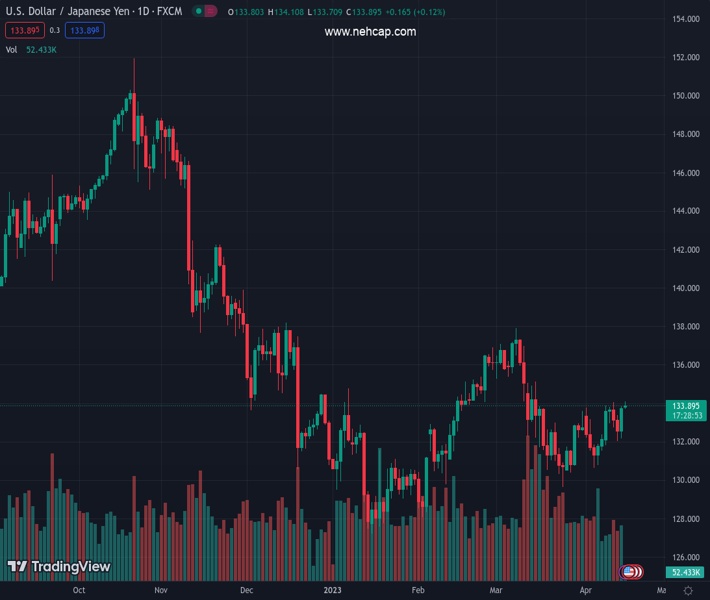
#USDJPY @ 133.858 is at a make or a break level around 134.00 amid the Ascending Triangle formation. (Pivot Orderbook analysis)
…
This is a premium post.
[s2If !current_user_can(access_s2member_level4)]Please register for PREMIUM VERSION HERE to read full post below containing analysis. In case of any error or you think you are not able to read the full post below, please email us at support#nehcap.com [lwa][/s2If] [s2If current_user_can(access_s2member_level4)]
- USD/JPY is at a make or a break level around 134.00 amid the Ascending Triangle formation.
- Multiple economic indicators are conveying that Fed would pause its policy-tightening spell sooner.
- The USD Index has sensed selling pressure while extending its upside above the immediate resistance of 101.8.
The pair currently trades last at 133.858.
The previous day high was 133.84 while the previous day low was 132.17. The daily 38.2% Fib levels comes at 133.2, expected to provide support. Similarly, the daily 61.8% fib level is at 132.81, expected to provide support.
The USD/JPY pair is juggling in a narrow range around 134.00 in the Asian session. The major is gathering strength to shift its business above the aforementioned resistance as investors are backing US Dollar on expectations of the continuation of the policy-tightening process by the Federal Reserve (Fed).
There is no denying the fact that loosening the United States labor market conditions, softening Consumer Price Index (CPI) and Producer Price Index (PPI) reports, and easing retail demand are conveying that the Fed has to pause its policy-tightening spell sooner. However, the core inflation has turned extremely stubborn and the fight against stick inflation has a lot more to come.
The US Dollar Index (DXY) has sensed selling pressure while extending its upside above the immediate resistance of 101.8, however, the upside bias is still solid.
On a two-hour scale, the asset is hovering near the horizontal resistance of the Ascending Triangle chart pattern plotted from March 16 high at 133.83. Upward-sloping trendline of the aforementioned chart pattern is placed from March 24 low at 129.64.
The major is confidently auctioning above the 20-period Exponential Moving Average (EMA) at 133.38, which indicates that the short-term trend is bullish.
Adding to that, the Relative Strength Index (RSI) (14) has shifted into the bullish range of 60.00-80.00, which indicates that the upside momentum is extremely bullish.
Going forward, a decisive break above the intraday high at 134.10 will drive the major toward March 06 low at 135.37 followed by March 10 high at 137.00.
On the contrary, a break below April 05 low at 130.63 would drag the asset toward the round-level support of 130.00. A break below the 130.00 support would expose the asset to March 24 low at 129.64.
Technical Levels: Supports and Resistances
USDJPY currently trading at 133.85 at the time of writing. Pair opened at 133.77 and is trading with a change of 0.06 % .
| Overview | Overview.1 | |
|---|---|---|
| 0 | Today last price | 133.85 |
| 1 | Today Daily Change | 0.08 |
| 2 | Today Daily Change % | 0.06 |
| 3 | Today daily open | 133.77 |
The pair is trading above its 20 Daily moving average @ 132.19, above its 50 Daily moving average @ 133.47 , above its 100 Daily moving average @ 133.14 and below its 200 Daily moving average @ 137.16
| Trends | Trends.1 | |
|---|---|---|
| 0 | Daily SMA20 | 132.19 |
| 1 | Daily SMA50 | 133.47 |
| 2 | Daily SMA100 | 133.14 |
| 3 | Daily SMA200 | 137.16 |
The previous day high was 133.84 while the previous day low was 132.17. The daily 38.2% Fib levels comes at 133.2, expected to provide support. Similarly, the daily 61.8% fib level is at 132.81, expected to provide support.
Note the levels of interest below:
- Pivot support is noted at 132.68, 131.59, 131.01
- Pivot resistance is noted at 134.35, 134.93, 136.02
| Levels | Levels.1 |
|---|---|
| Previous Daily High | 133.84 |
| Previous Daily Low | 132.17 |
| Previous Weekly High | 134.04 |
| Previous Weekly Low | 131.83 |
| Previous Monthly High | 137.91 |
| Previous Monthly Low | 129.64 |
| Daily Fibonacci 38.2% | 133.20 |
| Daily Fibonacci 61.8% | 132.81 |
| Daily Pivot Point S1 | 132.68 |
| Daily Pivot Point S2 | 131.59 |
| Daily Pivot Point S3 | 131.01 |
| Daily Pivot Point R1 | 134.35 |
| Daily Pivot Point R2 | 134.93 |
| Daily Pivot Point R3 | 136.02 |
[/s2If]
Join Our Telegram Group
")


