#USDIDR @ 14,780.0 fades bounce off eight-month low amid upbeat Indonesia trade numbers for February. (Pivot Orderbook analysis)
…
This is a premium post.
[s2If !current_user_can(access_s2member_level4)]Please register for PREMIUM VERSION HERE to read full post below containing analysis. In case of any error or you think you are not able to read the full post below, please email us at support#nehcap.com [lwa][/s2If] [s2If current_user_can(access_s2member_level4)]
- USD/IDR fades bounce off eight-month low amid upbeat Indonesia trade numbers for February.
- Indonesia Exports, Imports drop, trade surplus also deteriorates in March.
- US Dollar’s retreat mixed Fed concerns prod Indonesia Rupiah pair buyers.
- Bank Indonesia Interest Rate Decision, US PMIs will be in focus.
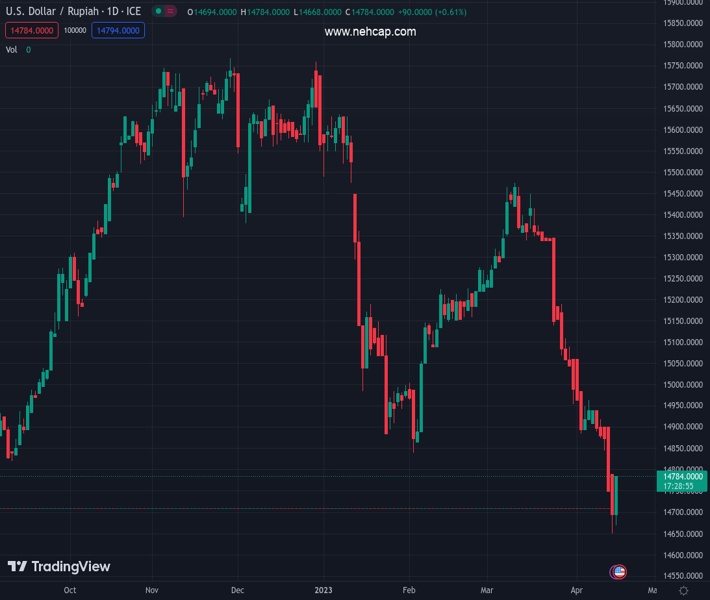
The pair currently trades last at 14780.0.
The previous day high was 14804.0 while the previous day low was 14644.0. The daily 38.2% Fib levels comes at 14742.88, expected to provide support. Similarly, the daily 61.8% fib level is at 14705.12, expected to provide support.
USD/IDR prints mild gains around 14,815 as it defends the previous day’s corrective bounce off the lowest levels since August 2022 during early Monday.
In doing so, the Indonesia Rupiah (IDR) pair cheers downbeat prints of the Asian nation’s foreign trade numbers for March. That said, Indonesia Exports dropped to -11.33% versus 4.51% prior and -15.00% expected figures. Further, Imports also declined by 6.26% versus -14.45% expected and -4.32% prior. Above all the Trade Balance eased to $2.91B compared to $5.48B prior and $3.99B market forecasts.
It’s worth noting, however, that the mixed sentiment in Asia, as well as the US Dollar’s corrective bounce off a multi-day low, also challenges the USD/IDR pair buyers. That said, a jump in China’s housing market data seemed to have favored the market’s latest consolidation. That said, China’s New Home Prices for March jumped at their fastest pace in 21 months while marking a three-month uptrend. On the contrary, the geopolitical challenges emanating from China, due to its eagerness to collaborate with Russia on global and regional security, as well as tussles with the US over Taiwan, prod the market sentiment.
On the other hand, doubts about the Federal Reserve’s (Fed) ability to hold the higher rates, after pausing the rate hike trajectory in May, join the recently firmer US data and hawkish Fed bets to challenge the USD/IDR pair traders.
A wider-than-expected fall in US Retail Sales failed to supersede upbeat figures from the US Industrial Production and University of Michigan’s (UoM) Consumer Confidence Index and allowed the US Dollar to rebound. Not only the data but hawkish comments from the Fed policymakers also enabled the greenback to pare the previous losses. Amid these plays, the CME’s FedWatch tool suggests an almost certain case of the US central bank’s 0.25% rate hike in May. It should be observed that the interest rate futures also tame the odds of the rate cuts in late 2023, as well as support the longer halt to the rate hike trajectory after the upcoming rate lift.
Moving on, risk catalysts may entertain USD/IDR pair traders ahead of Tuesday’s Bank Indonesia (BI) Interest Rate decision. That said, the BI is expected to keep the rates unchanged at 5.75% and may allow the pair buyers to extend the latest rebound. Following that, preliminary readings of PMIs for April will be important for fresh impulse.
Although double bottom around 14,640 challenges USD/IDR buyers, a daily closing beyond a one-month-old descending resistance line, around 14,845 at the latest, becomes necessary for the pair to reject the bearish bias.
Technical Levels: Supports and Resistances
USDIDR currently trading at 14803.05 at the time of writing. Pair opened at 14782.55 and is trading with a change of 0.14% % .
| Overview | Overview.1 | |
|---|---|---|
| 0 | Today last price | 14803.05 |
| 1 | Today Daily Change | 20.5000 |
| 2 | Today Daily Change % | 0.14% |
| 3 | Today daily open | 14782.55 |
The pair remains strongly bearish on the daily time frame. It trades below the 20 SMA @ 15013.1425, 50 SMA 15172.044, 100 SMA @ 15289.4615 and 200 SMA @ 15229.9995.
| Trends | Trends.1 | |
|---|---|---|
| 0 | Daily SMA20 | 15013.1425 |
| 1 | Daily SMA50 | 15172.0440 |
| 2 | Daily SMA100 | 15289.4615 |
| 3 | Daily SMA200 | 15229.9995 |
The previous day high was 14804.0 while the previous day low was 14644.0. The daily 38.2% Fib levels comes at 14742.88, expected to provide support. Similarly, the daily 61.8% fib level is at 14705.12, expected to provide support.
Note the levels of interest below:
- Pivot support is noted at 14683.0333, 14583.5167, 14523.0333
- Pivot resistance is noted at 14843.0333, 14903.5167, 15003.0333
| Levels | Levels.1 |
|---|---|
| Previous Daily High | 14804.0000 |
| Previous Daily Low | 14644.0000 |
| Previous Weekly High | 14966.0000 |
| Previous Weekly Low | 14644.0000 |
| Previous Monthly High | 15527.1500 |
| Previous Monthly Low | 14914.7500 |
| Daily Fibonacci 38.2% | 14742.8800 |
| Daily Fibonacci 61.8% | 14705.1200 |
| Daily Pivot Point S1 | 14683.0333 |
| Daily Pivot Point S2 | 14583.5167 |
| Daily Pivot Point S3 | 14523.0333 |
| Daily Pivot Point R1 | 14843.0333 |
| Daily Pivot Point R2 | 14903.5167 |
| Daily Pivot Point R3 | 15003.0333 |
[/s2If]
Join Our Telegram Group
")


