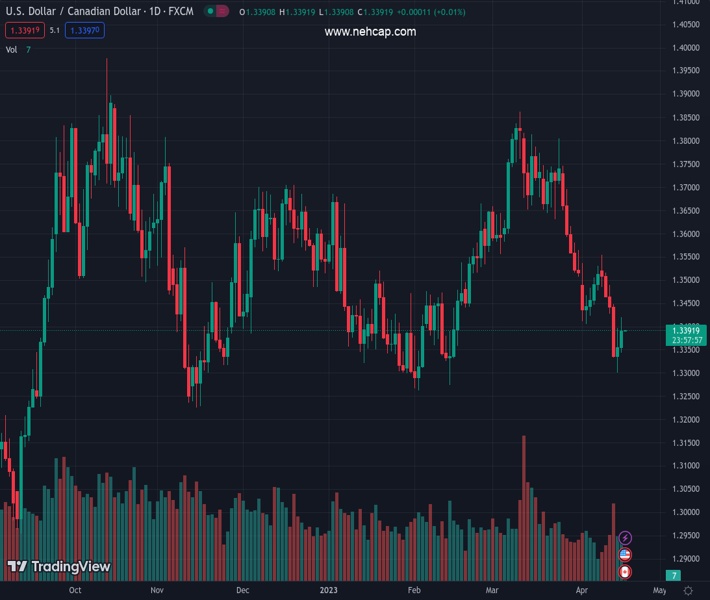
#USDCAD @ 1.33940 rises above the 200-day EMA but struggles to crack 1.3400. (Pivot Orderbook analysis)
…
This is a premium post.
[s2If !current_user_can(access_s2member_level4)]Please register for PREMIUM VERSION HERE to read full post below containing analysis. In case of any error or you think you are not able to read the full post below, please email us at support#nehcap.com [lwa][/s2If] [s2If current_user_can(access_s2member_level4)]
- USD/CAD rises above the 200-day EMA but struggles to crack 1.3400.
- Upside risks for the USD/CAD lie above 1.3400, which can trigger a rally toward 1.3500.
- USD/CAD failure to crack 1.3400 could pave the way for further losses.
The pair currently trades last at 1.33940.
The previous day high was 1.3396 while the previous day low was 1.3301. The daily 38.2% Fib levels comes at 1.336, expected to provide support. Similarly, the daily 61.8% fib level is at 1.3337, expected to provide support.
The USD/CAD advances after bottoming last Friday at around 1.3300; the pair bounces off and hovers nearby the 1.3400 figure after reaching a high of 1.3420. At the time of writing, the USD/CAD is trading at 1.3395 and is gaining 0.31%.
The USD/CAD dove to new 8-week lows at 1.3300, spurring an increase in the greenback’s demand, even though the Bank of Canada (BoC), in its latest monetary policy, announced the BoC Governing Council discussed raising rates. Nevertheless, current expectations for additional Fed tightening bolstered the US Dollar.
Given the backdrop, the USD/CAD is still neutral to downward biased, but it’s testing the upper boundaries of the 200-day Exponential Moving Average (EMA) at 1.3377. In addition, a daily close of the USD/CAD pair above the latter could exacerbate another leg-up in the pair, initially towards a downslope resistance trendline drawn from November 2022 highs that pass around the 1.3430-50 area. But firstly, the USD/CAD buyers need to reclaim 1.3400.
If USD/CAD cracks the 1.3400 figure, the next resistance would be the trendline mentioned above at 1.3430-50. Once cleared, the USD/CAD could threaten the confluence of the 20 and 100-day EMAs, around 1.3497-1.3504, before rallying towards the 50-day EMA At 1.3534.
Conversely, if USD/CAD stays below 1.3400, that could open the door for further downside. That said, the first support would be the 200-day EMA at 1.3377, followed by the April 17 low at 1.3342, before aiming toward the 1.3300 figure.
Technical Levels: Supports and Resistances
USDCAD currently trading at 1.3395 at the time of writing. Pair opened at 1.3371 and is trading with a change of 0.18 % .
| Overview | Overview.1 | |
|---|---|---|
| 0 | Today last price | 1.3395 |
| 1 | Today Daily Change | 0.0024 |
| 2 | Today Daily Change % | 0.1800 |
| 3 | Today daily open | 1.3371 |
The pair remains strongly bearish on the daily time frame. It trades below the 20 SMA @ 1.3545, 50 SMA 1.3563, 100 SMA @ 1.3531 and 200 SMA @ 1.3401.
| Trends | Trends.1 | |
|---|---|---|
| 0 | Daily SMA20 | 1.3545 |
| 1 | Daily SMA50 | 1.3563 |
| 2 | Daily SMA100 | 1.3531 |
| 3 | Daily SMA200 | 1.3401 |
The previous day high was 1.3396 while the previous day low was 1.3301. The daily 38.2% Fib levels comes at 1.336, expected to provide support. Similarly, the daily 61.8% fib level is at 1.3337, expected to provide support.
Note the levels of interest below:
- Pivot support is noted at 1.3316, 1.3262, 1.3222
- Pivot resistance is noted at 1.3411, 1.345, 1.3505
| Levels | Levels.1 |
|---|---|
| Previous Daily High | 1.3396 |
| Previous Daily Low | 1.3301 |
| Previous Weekly High | 1.3554 |
| Previous Weekly Low | 1.3301 |
| Previous Monthly High | 1.3862 |
| Previous Monthly Low | 1.3508 |
| Daily Fibonacci 38.2% | 1.3360 |
| Daily Fibonacci 61.8% | 1.3337 |
| Daily Pivot Point S1 | 1.3316 |
| Daily Pivot Point S2 | 1.3262 |
| Daily Pivot Point S3 | 1.3222 |
| Daily Pivot Point R1 | 1.3411 |
| Daily Pivot Point R2 | 1.3450 |
| Daily Pivot Point R3 | 1.3505 |
[/s2If]
Join Our Telegram Group
")


