#USDCAD @ 1.33909 scales higher for the second straight day and draws support from a combination of factors. (Pivot Orderbook analysis)
…
This is a premium post.
[s2If !current_user_can(access_s2member_level4)]Please register for PREMIUM VERSION HERE to read full post below containing analysis. In case of any error or you think you are not able to read the full post below, please email us at support#nehcap.com [lwa][/s2If] [s2If current_user_can(access_s2member_level4)]
- USD/CAD scales higher for the second straight day and draws support from a combination of factors.
- A modest downtick in Oil prices undermines the Loonie and acts as a tailwind amid a stronger USD.
- Bets for an imminent Fed rate-hike pause might hold back bulls from placing fresh bets and cap gains.
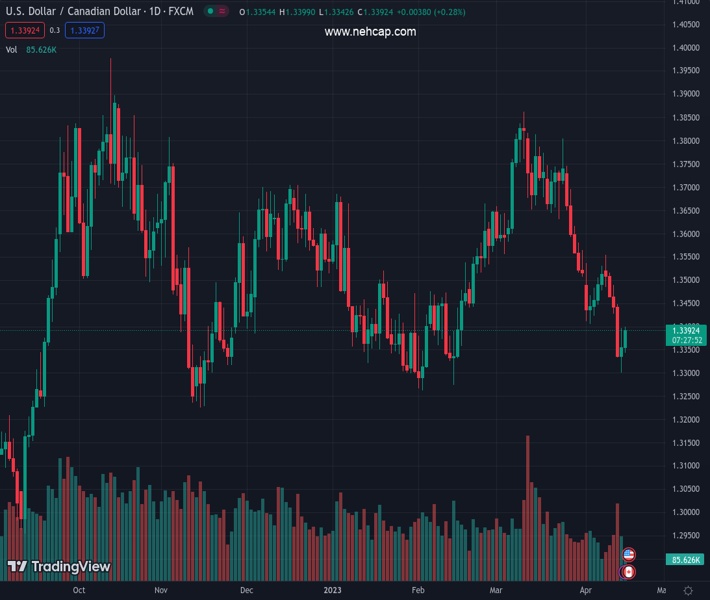
The pair currently trades last at 1.33909.
The previous day high was 1.3396 while the previous day low was 1.3301. The daily 38.2% Fib levels comes at 1.336, expected to provide support. Similarly, the daily 61.8% fib level is at 1.3337, expected to provide support.
The USD/CAD pair attracts fresh buying following an intraday dip to the 1.3340 area and turns positive for the second straight day on Monday. Spot prices climb back closer to the 1.3400 mark during the early North American session, with bulls now awaiting a move beyond the 200-day Simple Moving Average (SMA) before positioning for an extension of Friday’s bounce from a two-month low.
Crude Oil prices kick off the new week on a weaker note amid worries that a deeper global economic downturn will dent fuel demand, which, in turn, undermines the commodity-linked Loonie. The US Dollar (USD), on the other hand, recovers further from a one-year low touched on Friday amid speculations that the Federal Reserve (Fed) might continue raising interest rates. This is seen as another factor that acts as a tailwind for the USD/CAD pair and remains supportive of the intraday positive move.
In fact, the markets are currently pricing in a greater chance of another 25 bps lift-off at the next FOMC meeting in May. The bets were lifted by the University of Michigan’s preliminary report, which showed a rise in short-term inflation expectations during April. Furthermore, Fed Governor Christopher Waller on Friday called for further rate hikes and said that the job was still not done as inflation remains far too high. This continues to push the US Treasury bond yields higher and lifts the USD for the second straight day.
Investors, however, still seem convinced that the US central bank will pause its rate-hiking cycle, sooner rather than later, amid signs of easing inflationary pressures. In fact, the US CPI and the PPI report released last week indicated that disinflation is progressing smoothly. This, along with a positive risk tone, might cap the safe-haven USD and any meaningful upside for the USD/CAD pair.
Technical Levels: Supports and Resistances
USDCAD currently trading at 1.3392 at the time of writing. Pair opened at 1.3371 and is trading with a change of 0.16 % .
| Overview | Overview.1 | |
|---|---|---|
| 0 | Today last price | 1.3392 |
| 1 | Today Daily Change | 0.0021 |
| 2 | Today Daily Change % | 0.1600 |
| 3 | Today daily open | 1.3371 |
The pair remains strongly bearish on the daily time frame. It trades below the 20 SMA @ 1.3545, 50 SMA 1.3563, 100 SMA @ 1.3531 and 200 SMA @ 1.3401.
| Trends | Trends.1 | |
|---|---|---|
| 0 | Daily SMA20 | 1.3545 |
| 1 | Daily SMA50 | 1.3563 |
| 2 | Daily SMA100 | 1.3531 |
| 3 | Daily SMA200 | 1.3401 |
The previous day high was 1.3396 while the previous day low was 1.3301. The daily 38.2% Fib levels comes at 1.336, expected to provide support. Similarly, the daily 61.8% fib level is at 1.3337, expected to provide support.
Note the levels of interest below:
- Pivot support is noted at 1.3316, 1.3262, 1.3222
- Pivot resistance is noted at 1.3411, 1.345, 1.3505
| Levels | Levels.1 |
|---|---|
| Previous Daily High | 1.3396 |
| Previous Daily Low | 1.3301 |
| Previous Weekly High | 1.3554 |
| Previous Weekly Low | 1.3301 |
| Previous Monthly High | 1.3862 |
| Previous Monthly Low | 1.3508 |
| Daily Fibonacci 38.2% | 1.3360 |
| Daily Fibonacci 61.8% | 1.3337 |
| Daily Pivot Point S1 | 1.3316 |
| Daily Pivot Point S2 | 1.3262 |
| Daily Pivot Point S3 | 1.3222 |
| Daily Pivot Point R1 | 1.3411 |
| Daily Pivot Point R2 | 1.3450 |
| Daily Pivot Point R3 | 1.3505 |
[/s2If]
Join Our Telegram Group
")


