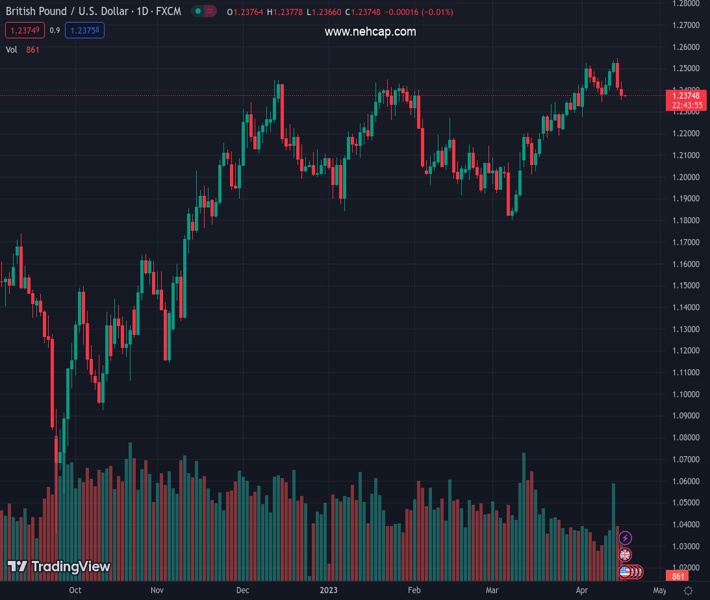
#GBPUSD @ 1.23750 remains pressured around one-week low after declining in the last two consecutive days., @nehcap view: Further downside expected (Pivot Orderbook analysis)
…
This is a premium post.
[s2If !current_user_can(access_s2member_level4)]Please register for PREMIUM VERSION HERE to read full post below containing analysis. In case of any error or you think you are not able to read the full post below, please email us at support#nehcap.com [lwa][/s2If] [s2If current_user_can(access_s2member_level4)]
- GBP/USD remains pressured around one-week low after declining in the last two consecutive days.
- Clear break of three-week-old ascending support line bearish MACD signals favor Cable sellers.
- Likely increase in UK Claimant Count Change for April may also weigh on GBP/USD price.
- Buyers need validation from 1.2435; convergence of 100, 50 DMA appears a tough nut to crack for bears.
The pair currently trades last at 1.23750.
The previous day high was 1.2546 while the previous day low was 1.2399. The daily 38.2% Fib levels comes at 1.2455, expected to provide resistance. Similarly, the daily 61.8% fib level is at 1.249, expected to provide resistance.
GBP/USD holds lower grounds near 1.2375 as bears flirt with seven-day bottom ahead of the key UK employment report on Tuesday. That said, the Cable pair dropped in the last two consecutive days.
Also read: GBP/USD falls on US Dollar strength amid Fed rate hike speculations
It should be noted that the quote’s clear downside break of an upward-sloping support line from March 24, now immediate resistance near 1.2435, joins bearish MACD signals to lure the GBP/USD bears ahead of the key UK statistics. However, the 21-DMA challenges the pair sellers around 1.2375 of late.
With this, the Cable pair is likely to break the immediate DMA support and can drop further toward the 1.2300 round figure. Though, a convergence of the 100-DMA and the 50-DMA, close to 1.2190 can challenge the pair sellers afterward.
It’s worth observing that February’s high of around 1.2270 can act as an intermediate halt between the 21-DMA and the aforementioned DMA convergence.
On the flip side, the GBP/USD pair’s clear recovery beyond 1.2435 support-turned-resistance will need validation from January’s high of around 1.2450.
Even so, a three-month-old upward-sloping resistance line, near 1.2545 can restrict the quote’s further upside.
Trend: Further downside expected
Technical Levels: Supports and Resistances
GBPUSD currently trading at 1.2379 at the time of writing. Pair opened at 1.2412 and is trading with a change of -0.27% % .
| Overview | Overview.1 | |
|---|---|---|
| 0 | Today last price | 1.2379 |
| 1 | Today Daily Change | -0.0033 |
| 2 | Today Daily Change % | -0.27% |
| 3 | Today daily open | 1.2412 |
The pair remains strongly bullish on the daily timeframe. It trades above its 20 SMA @ 1.237, 50 SMA 1.2173, 100 SMA @ 1.2182 and 200 SMA @ 1.1913.
| Trends | Trends.1 | |
|---|---|---|
| 0 | Daily SMA20 | 1.2370 |
| 1 | Daily SMA50 | 1.2173 |
| 2 | Daily SMA100 | 1.2182 |
| 3 | Daily SMA200 | 1.1913 |
The previous day high was 1.2546 while the previous day low was 1.2399. The daily 38.2% Fib levels comes at 1.2455, expected to provide resistance. Similarly, the daily 61.8% fib level is at 1.249, expected to provide resistance.
Note the levels of interest below:
- Pivot support is noted at 1.2359, 1.2306, 1.2212
- Pivot resistance is noted at 1.2506, 1.26, 1.2653
| Levels | Levels.1 |
|---|---|
| Previous Daily High | 1.2546 |
| Previous Daily Low | 1.2399 |
| Previous Weekly High | 1.2546 |
| Previous Weekly Low | 1.2344 |
| Previous Monthly High | 1.2424 |
| Previous Monthly Low | 1.1803 |
| Daily Fibonacci 38.2% | 1.2455 |
| Daily Fibonacci 61.8% | 1.2490 |
| Daily Pivot Point S1 | 1.2359 |
| Daily Pivot Point S2 | 1.2306 |
| Daily Pivot Point S3 | 1.2212 |
| Daily Pivot Point R1 | 1.2506 |
| Daily Pivot Point R2 | 1.2600 |
| Daily Pivot Point R3 | 1.2653 |
[/s2If]
Join Our Telegram Group
")


