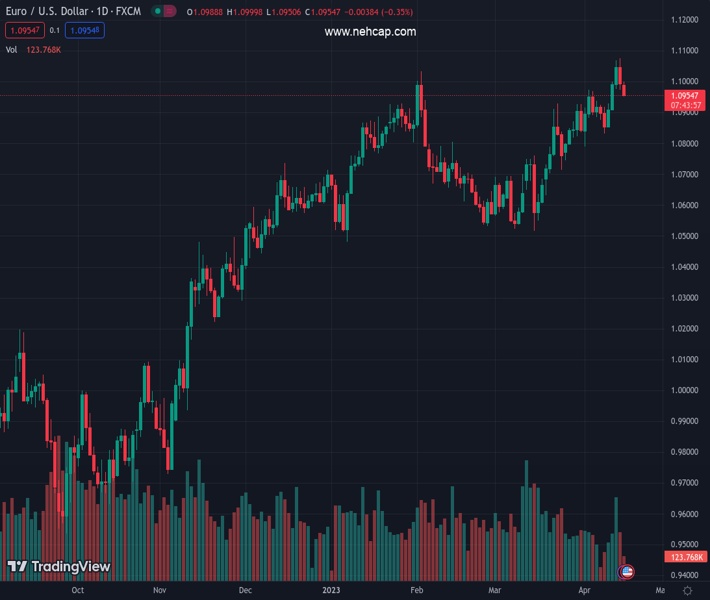
#EURUSD @ 1.09544 adds to Friday’s corrective decline well below 1.1000. (Pivot Orderbook analysis)
…
This is a premium post.
[s2If !current_user_can(access_s2member_level4)]Please register for PREMIUM VERSION HERE to read full post below containing analysis. In case of any error or you think you are not able to read the full post below, please email us at support#nehcap.com [lwa][/s2If] [s2If current_user_can(access_s2member_level4)]
- EUR/USD adds to Friday’s corrective decline well below 1.1000.
- The weekly low near 1.0830 emerges as the next support of note.
The pair currently trades last at 1.09544.
The previous day high was 1.1076 while the previous day low was 1.0972. The daily 38.2% Fib levels comes at 1.1012, expected to provide resistance. Similarly, the daily 61.8% fib level is at 1.1036, expected to provide resistance.
EUR/USD retreats to 3-day lows in the mid-1.0900s following a failed attempt to retake the key barrier at 1.1000 the figure on Monday.
Further weakness appears on the cards in the very near term for the pair. Against that, there is an initial support at the weekly low at 1.0831 (April 10) prior to April low at 1.0788 (April 3).
Looking at the longer run, the constructive view remains unchanged while above the 200-day SMA, today at 1.0373.
Technical Levels: Supports and Resistances
EURUSD currently trading at 1.0954 at the time of writing. Pair opened at 1.0992 and is trading with a change of -0.35 % .
| Overview | Overview.1 | |
|---|---|---|
| 0 | Today last price | 1.0954 |
| 1 | Today Daily Change | 49.0000 |
| 2 | Today Daily Change % | -0.3500 |
| 3 | Today daily open | 1.0992 |
The pair remains strongly bullish on the daily timeframe. It trades above its 20 SMA @ 1.0878, 50 SMA 1.0743, 100 SMA @ 1.071 and 200 SMA @ 1.037.
| Trends | Trends.1 | |
|---|---|---|
| 0 | Daily SMA20 | 1.0878 |
| 1 | Daily SMA50 | 1.0743 |
| 2 | Daily SMA100 | 1.0710 |
| 3 | Daily SMA200 | 1.0370 |
The previous day high was 1.1076 while the previous day low was 1.0972. The daily 38.2% Fib levels comes at 1.1012, expected to provide resistance. Similarly, the daily 61.8% fib level is at 1.1036, expected to provide resistance.
Note the levels of interest below:
- Pivot support is noted at 1.0951, 1.091, 1.0847
- Pivot resistance is noted at 1.1054, 1.1117, 1.1158
| Levels | Levels.1 |
|---|---|
| Previous Daily High | 1.1076 |
| Previous Daily Low | 1.0972 |
| Previous Weekly High | 1.1076 |
| Previous Weekly Low | 1.0837 |
| Previous Monthly High | 1.0930 |
| Previous Monthly Low | 1.0516 |
| Daily Fibonacci 38.2% | 1.1012 |
| Daily Fibonacci 61.8% | 1.1036 |
| Daily Pivot Point S1 | 1.0951 |
| Daily Pivot Point S2 | 1.0910 |
| Daily Pivot Point S3 | 1.0847 |
| Daily Pivot Point R1 | 1.1054 |
| Daily Pivot Point R2 | 1.1117 |
| Daily Pivot Point R3 | 1.1158 |
[/s2If]
Join Our Telegram Group
")


