DXY adds to Friday’s recovery and approaches the 102.00 barrier. (Pivot Orderbook analysis)
…
This is a premium post.
[s2If !current_user_can(access_s2member_level4)]Please register for PREMIUM VERSION HERE to read full post below containing analysis. In case of any error or you think you are not able to read the full post below, please email us at support#nehcap.com [lwa][/s2If] [s2If current_user_can(access_s2member_level4)]
- DXY adds to Friday’s recovery and approaches the 102.00 barrier.
- There are still chances of a breakdown of the 2023 peak near 100.80.
The pair currently trades last at 101.66.
The previous day high was 101.75 while the previous day low was 100.79. The daily 38.2% Fib levels comes at 101.38, expected to provide support. Similarly, the daily 61.8% fib level is at 101.15, expected to provide support.
DXY extends further Friday’s optimism and looks to retake the 102.00 neighbourhood at the beginning of the week.
Despite the ongoing rebound, the index is expected to remain under pressure for the time being. Against that, the loss of the 2023 low at 100.78 (April 14) should open the door to a deeper decline to, initially, the psychological 100.00 mark.
South from here aligns the late-March 2022 lows near 97.70.
Looking at the broader picture, while below the 200-day SMA, today at 106.33, the outlook for the index is expected to remain negative.
Technical Levels: Supports and Resistances
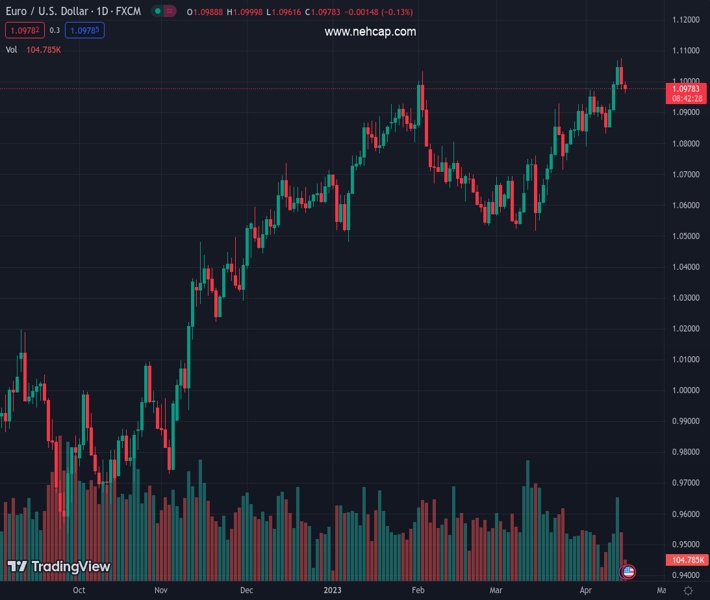
EURUSD currently trading at 101.66 at the time of writing. Pair opened at 101.58 and is trading with a change of 0.08 % .
| Overview | Overview.1 | |
|---|---|---|
| 0 | Today last price | 101.66 |
| 1 | Today Daily Change | 30.00 |
| 2 | Today Daily Change % | 0.08 |
| 3 | Today daily open | 101.58 |
The pair remains strongly bearish on the daily time frame. It trades below the 20 SMA @ 102.3, 50 SMA 103.47, 100 SMA @ 103.53 and 200 SMA @ 106.37.
| Trends | Trends.1 | |
|---|---|---|
| 0 | Daily SMA20 | 102.30 |
| 1 | Daily SMA50 | 103.47 |
| 2 | Daily SMA100 | 103.53 |
| 3 | Daily SMA200 | 106.37 |
The previous day high was 101.75 while the previous day low was 100.79. The daily 38.2% Fib levels comes at 101.38, expected to provide support. Similarly, the daily 61.8% fib level is at 101.15, expected to provide support.
Note the levels of interest below:
- Pivot support is noted at 100.99, 100.41, 100.04
- Pivot resistance is noted at 101.95, 102.33, 102.91
| Levels | Levels.1 |
|---|---|
| Previous Daily High | 101.75 |
| Previous Daily Low | 100.79 |
| Previous Weekly High | 102.76 |
| Previous Weekly Low | 100.79 |
| Previous Monthly High | 105.89 |
| Previous Monthly Low | 101.92 |
| Daily Fibonacci 38.2% | 101.38 |
| Daily Fibonacci 61.8% | 101.15 |
| Daily Pivot Point S1 | 100.99 |
| Daily Pivot Point S2 | 100.41 |
| Daily Pivot Point S3 | 100.04 |
| Daily Pivot Point R1 | 101.95 |
| Daily Pivot Point R2 | 102.33 |
| Daily Pivot Point R3 | 102.91 |
[/s2If]
Join Our Telegram Group
")


