Asian stocks are showing country-specific action despite a less volatile S&P500. (Pivot Orderbook analysis)
…
This is a premium post.
[s2If !current_user_can(access_s2member_level4)]Please register for PREMIUM VERSION HERE to read full post below containing analysis. In case of any error or you think you are not able to read the full post below, please email us at support#nehcap.com [lwa][/s2If] [s2If current_user_can(access_s2member_level4)]
- Asian stocks are showing country-specific action despite a less volatile S&P500.
- Chinese stocks are skyrocketing as the PBoC has promised a prudent monetary policy to trigger domestic demand.
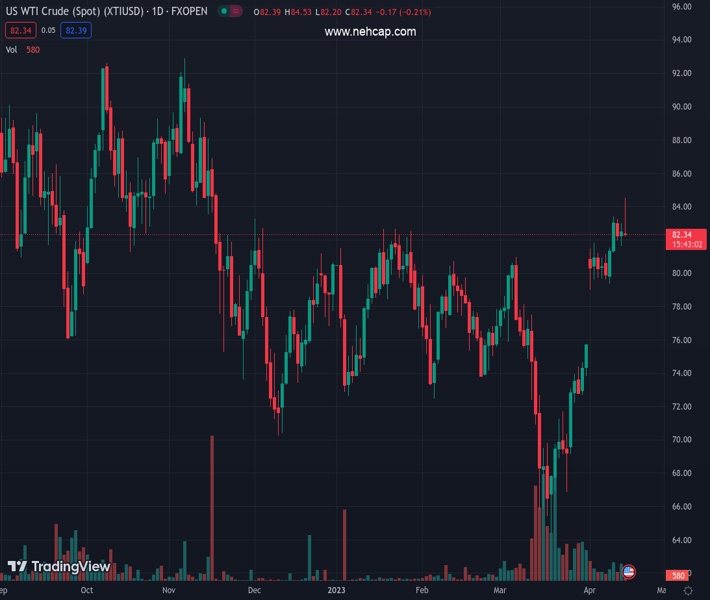
- A recovery in the US Dollar has weighed pressure on the oil price.
The pair currently trades last at 28477.11.
The previous day high was 28578.7 while the previous day low was 28309.83. The daily 38.2% Fib levels comes at 28475.99, expected to provide support. Similarly, the daily 61.8% fib level is at 28412.54, expected to provide support.
Markets in the Asian domain are showing country-specific action. Volatility in Asian stocks seems higher despite S&P500 remaining less volatile on Friday. US equities remained choppy but settled Friday’s session with some losses. Investors remained cautious about S&P500 as the Federal Reserve (Fed) is expected to continue its policy-tightening spell to its May monetary policy, citing that United States core inflation is extremely persistent.
The US Dollar Index (DXY) is showing signs of loss in the upside momentum after printing a high of 101.80. The upside in the USD Index seems capped due to the release of the weak US retail demand data. Retail Sales data contracted by 1.0% against expectations of 0.4% reported earlier as households postponed demand for goods with high price tags to avoid the higher cost of financing.
At the press time, Japan’s Nikkei225 remains flat, ChinaA50 soars 1.10%, Hang Seng gained 0.62%, and Nifty50 tumbled 1.10%.
Chinese stocks are skyrocketing as the People’s Bank of China (PBoC) has promised a prudent monetary policy to trigger domestic demand. Chinese inflation has been softening over the past few months despite the reopening of the economy after the rollback of pandemic controls. The PBoC is focusing on expanding retail demand as it will increase the confidence of consumers in the economy.
Meanwhile, economist at UOB Group Ho Woei Chen reviewed the latest trade balance figures in China. He stated, “Exports unexpectedly surged in Mar while imports were less robust but still came in above consensus expectation. China’s shipments improved amid the normalization of domestic production and stronger demand from the Asian and European markets.”
Japanese markets have turned choppy after a rally of a few trading sessions. The expectations of the continuation of expansionary policy from the Bank of Japan (BoJ) strengthened equities.
On the oil front, a recovery in the US Dollar has weighed pressure on the oil price. The black gold is hovering around $82.70.
Technical Levels: Supports and Resistances
XTIUSD currently trading at 28477.11 at the time of writing. Pair opened at 28477.11 and is trading with a change of 0.0 % .
| Overview | Overview.1 | |
|---|---|---|
| 0 | Today last price | 28477.11 |
| 1 | Today Daily Change | 0.00 |
| 2 | Today Daily Change % | 0.00 |
| 3 | Today daily open | 28477.11 |
The pair remains strongly bullish on the daily timeframe. It trades above its 20 SMA @ 27809.58, 50 SMA 27688.15, 100 SMA @ 27330.99 and 200 SMA @ 27466.13.
| Trends | Trends.1 | |
|---|---|---|
| 0 | Daily SMA20 | 27809.58 |
| 1 | Daily SMA50 | 27688.15 |
| 2 | Daily SMA100 | 27330.99 |
| 3 | Daily SMA200 | 27466.13 |
The previous day high was 28578.7 while the previous day low was 28309.83. The daily 38.2% Fib levels comes at 28475.99, expected to provide support. Similarly, the daily 61.8% fib level is at 28412.54, expected to provide support.
Note the levels of interest below:
- Pivot support is noted at 28331.73, 28186.34, 28062.86
- Pivot resistance is noted at 28600.6, 28724.08, 28869.47
| Levels | Levels.1 |
|---|---|
| Previous Daily High | 28578.70 |
| Previous Daily Low | 28309.83 |
| Previous Weekly High | 28578.70 |
| Previous Weekly Low | 27650.84 |
| Previous Monthly High | 28630.69 |
| Previous Monthly Low | 26446.43 |
| Daily Fibonacci 38.2% | 28475.99 |
| Daily Fibonacci 61.8% | 28412.54 |
| Daily Pivot Point S1 | 28331.73 |
| Daily Pivot Point S2 | 28186.34 |
| Daily Pivot Point S3 | 28062.86 |
| Daily Pivot Point R1 | 28600.60 |
| Daily Pivot Point R2 | 28724.08 |
| Daily Pivot Point R3 | 28869.47 |
[/s2If]
Join Our Telegram Group
")


