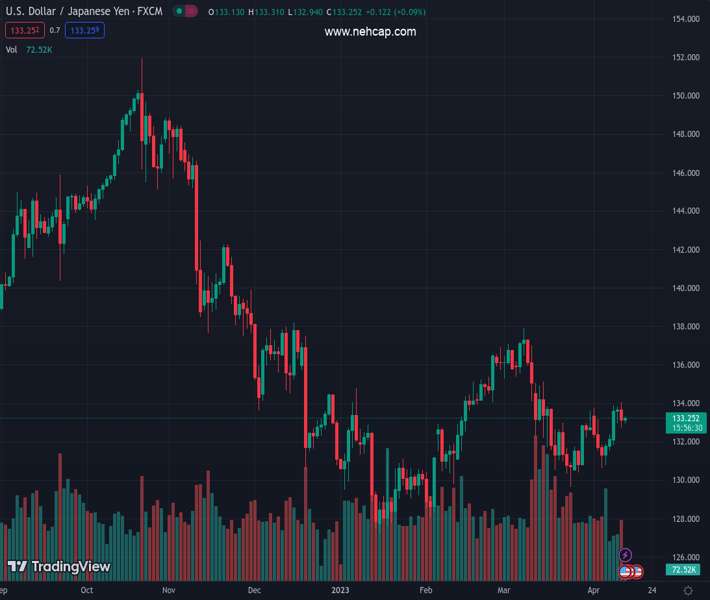
#USDJPY @ 133.258 picks up bids to reverses the previous day’s pullback from one-month high. (Pivot Orderbook analysis)
…
This is a premium post.
[s2If !current_user_can(access_s2member_level4)]Please register for PREMIUM VERSION HERE to read full post below containing analysis. In case of any error or you think you are not able to read the full post below, please email us at support#nehcap.com [lwa][/s2If] [s2If current_user_can(access_s2member_level4)]
- USD/JPY picks up bids to reverses the previous day’s pullback from one-month high.
- BoJ’s new Governor Ueda defends current monetary policy, eyes easing inflation.
- Softer US CPI, downbeat Fed Minutes weigh on US Dollar, yields despite latest corrective bounce.
- Risk catalysts, Fed talks eyed for clear directions.
The pair currently trades last at 133.258.
The previous day high was 134.04 while the previous day low was 132.74. The daily 38.2% Fib levels comes at 133.24, expected to provide support. Similarly, the daily 61.8% fib level is at 133.55, expected to provide resistance.
USD/JPY remains sidelined around 133.20 during sluggish trading hours of early Thursday morning in Europe. In doing so, the Yen pair traces a mild recovery in the US Treasury bond yields while also cheering new Bank of Japan (BoJ) Governor Kazuo Ueda’s defense of the ultra-easy monetary policy.
Early in Asia, Bank of Japan (BoJ) Governor Kazuo Ueda tried to defend the Japanese central bank’s easy-money policy while speaking at the Group of Seven (G7) nations’ gathering in Washington. “BoJ will continue monetary easing until the price target is stable and sustainably achieved,” said BoJ’s Ueda while also adding that Japan’s consumer inflation is currently around 3% but likely to slow ahead.
It should be noted that the US 10-year and two-year Treasury bond yields print mild gains around 3.41% and 3.98% respectively. That said, the US 10-year Treasury bond yields snapped a three-day uptrend with mild losses to around 3.40% while the two-year counterpart also eased to 3.96% by marking the first daily negative in five.
Additionally, Japan’s recalling of the emergency evacuation order after North Korean missile testing also provides a tailwind to the risk barometer pair.
Elsewhere, the odds of the US Federal Reserve’s (Fed) policy pivot increase after downbeat US inflation data and unimpressive FOMC Minutes, which in turn drowned US Dollar and Treasury bond yields the previous day, especially amid the recession woes.
On Wednesday, US Consumer Price Index (CPI) dropped to the lowest level since May 2021, to 5.0% YoY in March from 6.0% prior and versus 5.2% market forecasts. However, the annual Core CPI, namely the CPI ex Food & Energy, improved to 5.6% YoY during the said month while matching forecasts and surpassing 5.5% prior.
On the same line, the Minutes of the latest Federal Open Market Committee (FOMC) Monetary Policy Meeting also challenged the Fed hawks by stating that the expectations for rate hikes were scaled back due to the turmoil in the banking sector. Furthermore, the latest comments from the Fed policymakers, including San Francisco Federal Reserve Bank President Mary Daly and Richmond Federal Reserve President Thomas Barkin, suggest easing inflation and challenges to the hawkish Fed, as well as for the US Dollar.
Amid these plays, S&P 500 Futures print mild gains despite downbeat Wall Street closing whereas Japan’s Nikkei 225 rise 0.60% intraday as we write.
Although a light calendar and mixed mood restrict USD/JPY moves of late, today’s US Producer Price Index (PPI) for March and Friday’s preliminary readings of the Michigan Consumer Sentiment Index for April can entertain the Yen pair traders.
Repeated failures to cross the 200-day Exponential Moving Average (EMA), around 133.75 by the press time, tease USD/JPY bears to aim for a three-week-old support line, near 131.30 at the latest.
Technical Levels: Supports and Resistances
USDJPY currently trading at 133.24 at the time of writing. Pair opened at 133.16 and is trading with a change of 0.06% % .
| Overview | Overview.1 | |
|---|---|---|
| 0 | Today last price | 133.24 |
| 1 | Today Daily Change | 0.08 |
| 2 | Today Daily Change % | 0.06% |
| 3 | Today daily open | 133.16 |
The pair is trading above its 20 Daily moving average @ 132.15, below its 50 Daily moving average @ 133.34 , below its 100 Daily moving average @ 133.25 and below its 200 Daily moving average @ 137.19
| Trends | Trends.1 | |
|---|---|---|
| 0 | Daily SMA20 | 132.15 |
| 1 | Daily SMA50 | 133.34 |
| 2 | Daily SMA100 | 133.25 |
| 3 | Daily SMA200 | 137.19 |
The previous day high was 134.04 while the previous day low was 132.74. The daily 38.2% Fib levels comes at 133.24, expected to provide support. Similarly, the daily 61.8% fib level is at 133.55, expected to provide resistance.
Note the levels of interest below:
- Pivot support is noted at 132.58, 132.01, 131.27
- Pivot resistance is noted at 133.89, 134.62, 135.19
| Levels | Levels.1 |
|---|---|
| Previous Daily High | 134.04 |
| Previous Daily Low | 132.74 |
| Previous Weekly High | 133.76 |
| Previous Weekly Low | 130.63 |
| Previous Monthly High | 137.91 |
| Previous Monthly Low | 129.64 |
| Daily Fibonacci 38.2% | 133.24 |
| Daily Fibonacci 61.8% | 133.55 |
| Daily Pivot Point S1 | 132.58 |
| Daily Pivot Point S2 | 132.01 |
| Daily Pivot Point S3 | 131.27 |
| Daily Pivot Point R1 | 133.89 |
| Daily Pivot Point R2 | 134.62 |
| Daily Pivot Point R3 | 135.19 |
[/s2If]
Join Our Telegram Group
")


