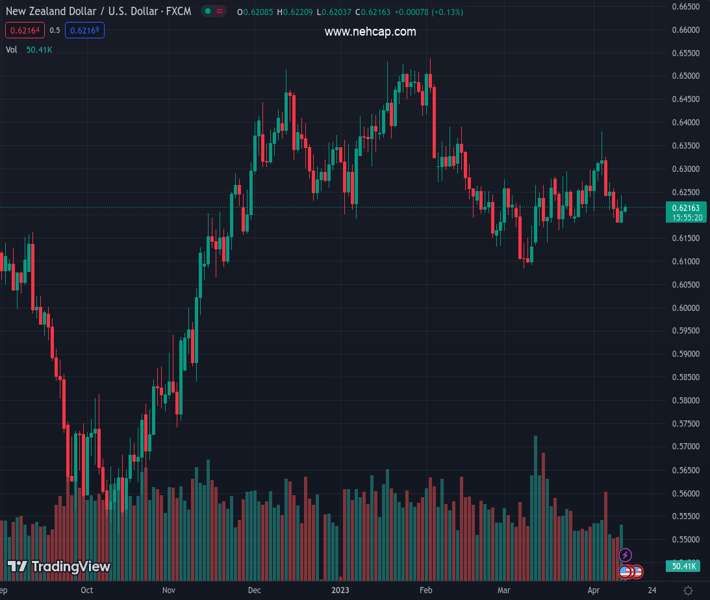
#NZDUSD @ 0.62156 has remained lackluster despite the release of solid China Trade Balance data. (Pivot Orderbook analysis)
…
This is a premium post.
[s2If !current_user_can(access_s2member_level4)]Please register for PREMIUM VERSION HERE to read full post below containing analysis. In case of any error or you think you are not able to read the full post below, please email us at support#nehcap.com [lwa][/s2If] [s2If current_user_can(access_s2member_level4)]
- NZD/USD has remained lackluster despite the release of solid China Trade Balance data.
- China’s annual Imports have contracted by 1.4% while Exports have expanded significantly by 14.8%.
- The Kiwi asset has been in a negative trajectory after a breakdown of the Rising Channel.
The pair currently trades last at 0.62156.
The previous day high was 0.6242 while the previous day low was 0.6169. The daily 38.2% Fib levels comes at 0.6214, expected to provide support. Similarly, the daily 61.8% fib level is at 0.6197, expected to provide support.
The NZD/USD pair is displaying back-and-forth moves in a narrow range of 0.6210-0.6220 in the Asian session. The Kiwi asset has turned sideways as the US Dollar Index has shown some recovery after an intense sell-off. Also, upbeat China’s international trade data (March) has failed to infuse blood into the New Zealand Dollar.
China’s Trade Balance data (in US Dollars) has landed at $88.19B, significantly higher than the consensus of $39.2B but lower than the former release of $116.8 B. Annual Imports have contracted by 1.4% while the street was expecting a contraction of 5%. However, Exports have expanded significantly by 14.8% against a contraction of 7.0% as expected.
It is worth noting that New Zealand is one of the leading trading partners of China and a lower-than-expected contraction in Chinese Imports would be supportive of the New Zealand Dollar.
Meanwhile, the USD Index is making efforts for keeping its feet steady above 101.50.
The New Zealand Dollar has been in a negative trajectory after a breakdown of the Rising Channel chart pattern formed on a four-hour scale. Also, the 20-and 50-period Exponential Moving Averages (EMAs) at 0.6217 and 0.6236 respectively are acting as barricades for the New Zealand Dollar. Potential horizontal support is plotted from March 08 low at 0.6084.
The Relative Strength Index (RSI) (14) has shifted into the 40.00-60.00 range from the bearish range of 20.00-40.00, which indicates a loss in the downside momentum..
A downside will be witnessed if the Kiwi asset surrenders April 11 low near 0.6170, which will drag the major to March 15 low at 0.6139 followed by March 08 low at 0.6084.
Alternatively, a decisive upside move above February 07 high at 0.6363 will expose the Kiwi asset to the round-level resistance at 0.6400 and December 05 high at 0.6443.
Technical Levels: Supports and Resistances
NZDUSD currently trading at 0.6217 at the time of writing. Pair opened at 0.6222 and is trading with a change of -0.08 % .
| Overview | Overview.1 | |
|---|---|---|
| 0 | Today last price | 0.6217 |
| 1 | Today Daily Change | -0.0005 |
| 2 | Today Daily Change % | -0.0800 |
| 3 | Today daily open | 0.6222 |
The pair is trading below its 20 Daily moving average @ 0.6243, below its 50 Daily moving average @ 0.6243 , below its 100 Daily moving average @ 0.6304 and above its 200 Daily moving average @ 0.6161
| Trends | Trends.1 | |
|---|---|---|
| 0 | Daily SMA20 | 0.6243 |
| 1 | Daily SMA50 | 0.6243 |
| 2 | Daily SMA100 | 0.6304 |
| 3 | Daily SMA200 | 0.6161 |
The previous day high was 0.6242 while the previous day low was 0.6169. The daily 38.2% Fib levels comes at 0.6214, expected to provide support. Similarly, the daily 61.8% fib level is at 0.6197, expected to provide support.
Note the levels of interest below:
- Pivot support is noted at 0.618, 0.6138, 0.6107
- Pivot resistance is noted at 0.6253, 0.6284, 0.6326
| Levels | Levels.1 |
|---|---|
| Previous Daily High | 0.6242 |
| Previous Daily Low | 0.6169 |
| Previous Weekly High | 0.6389 |
| Previous Weekly Low | 0.6207 |
| Previous Monthly High | 0.6298 |
| Previous Monthly Low | 0.6084 |
| Daily Fibonacci 38.2% | 0.6214 |
| Daily Fibonacci 61.8% | 0.6197 |
| Daily Pivot Point S1 | 0.6180 |
| Daily Pivot Point S2 | 0.6138 |
| Daily Pivot Point S3 | 0.6107 |
| Daily Pivot Point R1 | 0.6253 |
| Daily Pivot Point R2 | 0.6284 |
| Daily Pivot Point R3 | 0.6326 |
[/s2If]
Join Our Telegram Group
")


