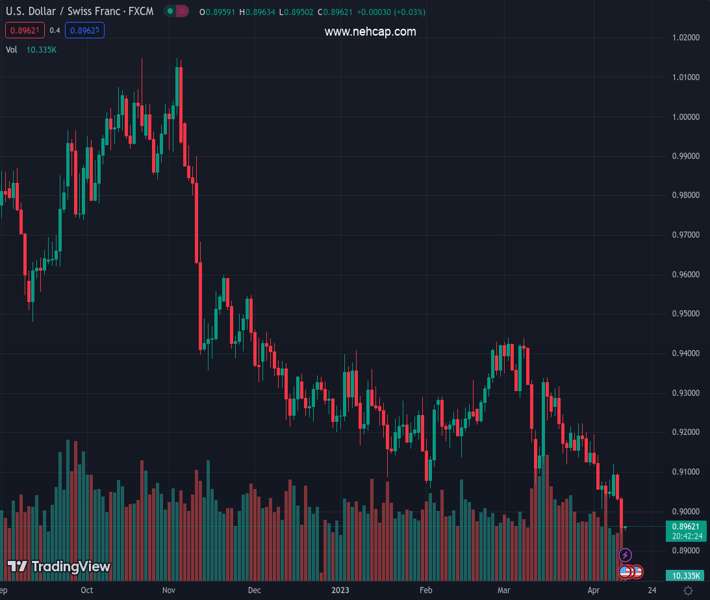
#USDCHF @ 0.89614 is expected to extend its downside journey to a fresh 21-month low below 0.8930 as US inflation has softened further. (Pivot Orderbook analysis)
…
This is a premium post.
[s2If !current_user_can(access_s2member_level4)]Please register for PREMIUM VERSION HERE to read full post below containing analysis. In case of any error or you think you are not able to read the full post below, please email us at support#nehcap.com [lwa][/s2If] [s2If current_user_can(access_s2member_level4)]
- USD/CHF is expected to extend its downside journey to a fresh 21-month low below 0.8930 as US inflation has softened further.
- Lower gasoline prices would impact the input cost and its effects will be observed in the prices of goods and services.
- S&P500 futures have extended their downside as Fed policymakers are anticipating a mild recession.
The pair currently trades last at 0.89614.
The previous day high was 0.9039 while the previous day low was 0.8944. The daily 38.2% Fib levels comes at 0.898, expected to provide resistance. Similarly, the daily 61.8% fib level is at 0.9002, expected to provide resistance.
The USD/CHF pair is juggling around its fresh annual low at 0.8943 in the Asian session. The Swiss Franc asset witnessed an intense sell-off on Wednesday after the United States inflation softened more than estimates.
On Wednesday, US headline Consumer Price Index (CPI) was reported at 5.0% while the street was estimating it at 5.2%. Headline CPI has decelerated to 5% from its peak of 9.1% and for that, the Federal Reserve (Fed) has gone through rigorous rate hikes. However, the core inflation that doesn’t include oil and gas prices rebounded to 5.6%, which indicates that Fed chair Jerome Powell has a lot to do to bring down inflationary pressures to 2%.
San Francisco Fed Bank President Mary Daly said late Wednesday, “There’s a lot more in the pipeline of monetary policy tightening,” as reported by Reuters. However, she refrained from forecasting the end of the tightening cycle
US inflation softening weighed heavily on the US Dollar Index (DXY). The USD Index has continued its downside momentum as a consistent deceleration in inflationary pressures has cemented an early pause to the policy-tightening cycle by the Fed.
Meanwhile, S&P500 futures have extended their downside after a bearish Wednesday as Fed minutes have conveyed that policymakers are anticipating a mild recession later this year, portraying a lower risk appetite for equities.
Going forward, US Producer Price Index (PPI) data will be keenly watched. Lower gasoline prices have reduced overall input costs for the production of goods and services and its impact will be observed in their prices fixed at factory gates. Monthly headline PPI is expected to remain stagnant against a deflation of 0.1%. Annual headline PPI would soften heavily to 3.0% from the prior release of 4.6%.
On the Swiss Franc front, the bailout proposal for Credit Suisse failed to get a blessing from Switzerland’s parliament. Switzerland’s parliament rejected on Wednesday the government’s 109 billion Swiss francs ($120.82 billion) aid for Credit Suisse’s merger with UBS as reported by Reuters.
Technical Levels: Supports and Resistances
USDCHF currently trading at 0.8958 at the time of writing. Pair opened at 0.8961 and is trading with a change of -0.03 % .
| Overview | Overview.1 | |
|---|---|---|
| 0 | Today last price | 0.8958 |
| 1 | Today Daily Change | -0.0003 |
| 2 | Today Daily Change % | -0.0300 |
| 3 | Today daily open | 0.8961 |
The pair remains strongly bearish on the daily time frame. It trades below the 20 SMA @ 0.9143, 50 SMA 0.9228, 100 SMA @ 0.9263 and 200 SMA @ 0.9497.
| Trends | Trends.1 | |
|---|---|---|
| 0 | Daily SMA20 | 0.9143 |
| 1 | Daily SMA50 | 0.9228 |
| 2 | Daily SMA100 | 0.9263 |
| 3 | Daily SMA200 | 0.9497 |
The previous day high was 0.9039 while the previous day low was 0.8944. The daily 38.2% Fib levels comes at 0.898, expected to provide resistance. Similarly, the daily 61.8% fib level is at 0.9002, expected to provide resistance.
Note the levels of interest below:
- Pivot support is noted at 0.8924, 0.8886, 0.8828
- Pivot resistance is noted at 0.9018, 0.9076, 0.9113
| Levels | Levels.1 |
|---|---|
| Previous Daily High | 0.9039 |
| Previous Daily Low | 0.8944 |
| Previous Weekly High | 0.9198 |
| Previous Weekly Low | 0.9007 |
| Previous Monthly High | 0.9440 |
| Previous Monthly Low | 0.9072 |
| Daily Fibonacci 38.2% | 0.8980 |
| Daily Fibonacci 61.8% | 0.9002 |
| Daily Pivot Point S1 | 0.8924 |
| Daily Pivot Point S2 | 0.8886 |
| Daily Pivot Point S3 | 0.8828 |
| Daily Pivot Point R1 | 0.9018 |
| Daily Pivot Point R2 | 0.9076 |
| Daily Pivot Point R3 | 0.9113 |
[/s2If]
Join Our Telegram Group
")


