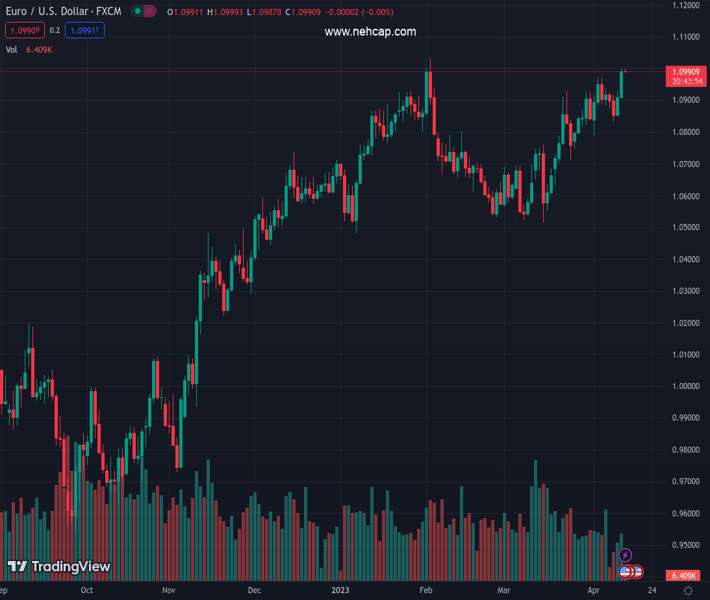
#EURUSD @ 1.09914 seesaws around 10-week high after rising in the last two consecutive day., @nehcap view: Limited upside expected (Pivot Orderbook analysis)
…
This is a premium post.
[s2If !current_user_can(access_s2member_level4)]Please register for PREMIUM VERSION HERE to read full post below containing analysis. In case of any error or you think you are not able to read the full post below, please email us at support#nehcap.com [lwa][/s2If] [s2If current_user_can(access_s2member_level4)]
- EUR/USD seesaws around 10-week high after rising in the last two consecutive day.
- Three-week-old rising wedge’s top line joins overbought RSI (14) to challenge Euro bulls.
- Multiple hurdles towards the south to challenge EUR/USD bears, 1.0755 is the key.
The pair currently trades last at 1.09914.
The previous day high was 1.1 while the previous day low was 1.0911. The daily 38.2% Fib levels comes at 1.0966, expected to provide support. Similarly, the daily 61.8% fib level is at 1.0945, expected to provide support.
EUR/USD bulls take a breather around 1.1000, making rounds to 2.5-month high amid a three-day uptrend during early Thursday.
The major currency pair’s latest run-up could be linked to a successful break of the previous weekly high, as well as the bullish MACD signals. However, the top line of a three-week-old rising wedge bearish chart formation joins overbought RSI (14) conditions to challenge the Euro bulls of late.
As a result, the EUR/USD pair’s upside appears to have little room unless it successfully stays beyond the 1.1010 immediate resistance.
Even if the quote manages to cross the 1.1010 hurdle, the Year-To-Date (YTD) high marked in February at around 1.1035 can act as an extra filter towards the north before directing EUR/USD towards the late March 2022 high of around 1.1185.
Alternatively, a downside break of one-week-old horizontal support around 1.0975-70, the previous resistance, puts a floor under the EUR/USD prices for intraday. Following that, a three-week-long horizontal support zone near 1.0930 will challenge the pair sellers.
However, a convergence of the 100-SMA and the stated wedge’s bottom line, around 1.0870-65, becomes crucial to watch during the quote’s further downside.
It should be noted that the 200-SMA level surrounding 1.0755 acts as an extra filter towards the south.
Trend: Limited upside expected
Technical Levels: Supports and Resistances
EURUSD currently trading at 1.0997 at the time of writing. Pair opened at 1.0992 and is trading with a change of 0.05% % .
| Overview | Overview.1 | |
|---|---|---|
| 0 | Today last price | 1.0997 |
| 1 | Today Daily Change | 0.0005 |
| 2 | Today Daily Change % | 0.05% |
| 3 | Today daily open | 1.0992 |
The pair remains strongly bullish on the daily timeframe. It trades above its 20 SMA @ 1.0839, 50 SMA 1.0736, 100 SMA @ 1.0698 and 200 SMA @ 1.0362.
| Trends | Trends.1 | |
|---|---|---|
| 0 | Daily SMA20 | 1.0839 |
| 1 | Daily SMA50 | 1.0736 |
| 2 | Daily SMA100 | 1.0698 |
| 3 | Daily SMA200 | 1.0362 |
The previous day high was 1.1 while the previous day low was 1.0911. The daily 38.2% Fib levels comes at 1.0966, expected to provide support. Similarly, the daily 61.8% fib level is at 1.0945, expected to provide support.
Note the levels of interest below:
- Pivot support is noted at 1.0935, 1.0878, 1.0845
- Pivot resistance is noted at 1.1025, 1.1057, 1.1114
| Levels | Levels.1 |
|---|---|
| Previous Daily High | 1.1000 |
| Previous Daily Low | 1.0911 |
| Previous Weekly High | 1.0973 |
| Previous Weekly Low | 1.0788 |
| Previous Monthly High | 1.0930 |
| Previous Monthly Low | 1.0516 |
| Daily Fibonacci 38.2% | 1.0966 |
| Daily Fibonacci 61.8% | 1.0945 |
| Daily Pivot Point S1 | 1.0935 |
| Daily Pivot Point S2 | 1.0878 |
| Daily Pivot Point S3 | 1.0845 |
| Daily Pivot Point R1 | 1.1025 |
| Daily Pivot Point R2 | 1.1057 |
| Daily Pivot Point R3 | 1.1114 |
[/s2If]
Join Our Telegram Group
")


