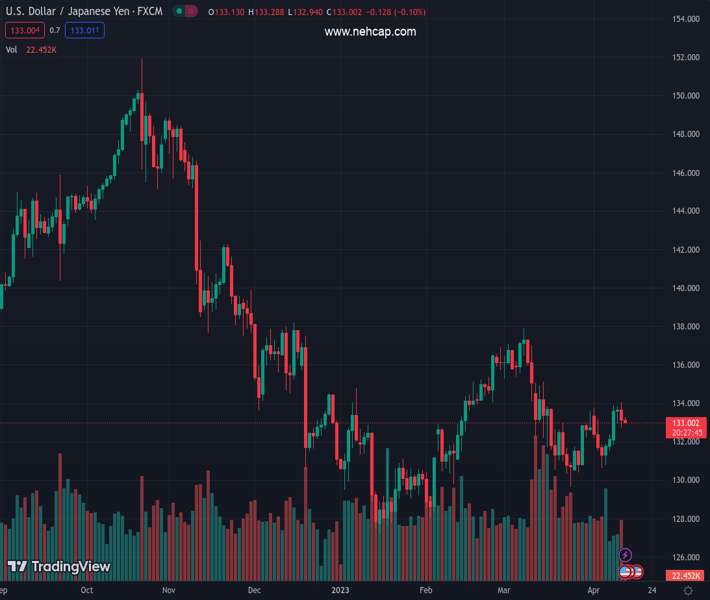
#USDJPY @ 133.350 snaps three-day uptrend while retreating from the highest levels in three weeks., @nehcap view: Limited downside expected (Pivot Orderbook analysis)
…
This is a premium post.
[s2If !current_user_can(access_s2member_level4)]Please register for PREMIUM VERSION HERE to read full post below containing analysis. In case of any error or you think you are not able to read the full post below, please email us at support#nehcap.com [lwa][/s2If] [s2If current_user_can(access_s2member_level4)]
- USD/JPY snaps three-day uptrend while retreating from the highest levels in three weeks.
- RSI’s pullback from overbought territory adds strength to the downside bias.
- Convergence of one-week-old ascending trend line, 50-SMA restricts Yen pair’s short-term fall.
- Bears need validation from 12-day-long upward-sloping trend line to retake control.
The pair currently trades last at 133.350.
The previous day high was 133.82 while the previous day low was 131.83. The daily 38.2% Fib levels comes at 133.06, expected to provide support. Similarly, the daily 61.8% fib level is at 132.59, expected to provide support.
USD/JPY drops to 133.40 as bulls take a breather after a three-day uptrend during early Tuesday. In doing so, the Yen pair takes a U-turn from a three-week-old horizontal resistance area, as well as the 200-SMA.
Adding strength to the pullback moves could be the RSI (14) retreat from the overbought territory.
As a result, the Yen pair is well-set for further downside towards the 132.40-35 support confluence including the 50-SMA and one-week-old ascending trend line.
It should be noted, however, that there prevails limited room towards the south for the USD/JPY pair even if it breaks the 132.35 key support. The reason could be linked to an upward-sloping support line from March 24, close to 131.10 by the press time.
In a case where the USD/JPY bears keep the reins past 131.10, and also conquer the 131.00 round figure, the odds of witnessing a fresh 2023 low, currently around 127.20, can’t be ruled out.
On the contrary, the 200-SMA level of 133.60 precedes the aforementioned three-week-old horizontal resistance area surrounding 133.75-85 to limit the short-term upside of the USD/JPY pair.
Following that, the mid-March high of 135.05 acts as an intermediate halt during the likely run-up towards the YTD peak marked in the previous month at around 137.95.
Trend: Limited downside expected
Technical Levels: Supports and Resistances
USDJPY currently trading at 133.35 at the time of writing. Pair opened at 133.62 and is trading with a change of -0.20% % .
| Overview | Overview.1 | |
|---|---|---|
| 0 | Today last price | 133.35 |
| 1 | Today Daily Change | -0.27 |
| 2 | Today Daily Change % | -0.20% |
| 3 | Today daily open | 133.62 |
The pair is trading above its 20 Daily moving average @ 132.19, above its 50 Daily moving average @ 133.19 , below its 100 Daily moving average @ 133.39 and below its 200 Daily moving average @ 137.21
| Trends | Trends.1 | |
|---|---|---|
| 0 | Daily SMA20 | 132.19 |
| 1 | Daily SMA50 | 133.19 |
| 2 | Daily SMA100 | 133.39 |
| 3 | Daily SMA200 | 137.21 |
The previous day high was 133.82 while the previous day low was 131.83. The daily 38.2% Fib levels comes at 133.06, expected to provide support. Similarly, the daily 61.8% fib level is at 132.59, expected to provide support.
Note the levels of interest below:
- Pivot support is noted at 132.36, 131.1, 130.37
- Pivot resistance is noted at 134.35, 135.08, 136.34
| Levels | Levels.1 |
|---|---|
| Previous Daily High | 133.82 |
| Previous Daily Low | 131.83 |
| Previous Weekly High | 133.76 |
| Previous Weekly Low | 130.63 |
| Previous Monthly High | 137.91 |
| Previous Monthly Low | 129.64 |
| Daily Fibonacci 38.2% | 133.06 |
| Daily Fibonacci 61.8% | 132.59 |
| Daily Pivot Point S1 | 132.36 |
| Daily Pivot Point S2 | 131.10 |
| Daily Pivot Point S3 | 130.37 |
| Daily Pivot Point R1 | 134.35 |
| Daily Pivot Point R2 | 135.08 |
| Daily Pivot Point R3 | 136.34 |
[/s2If]
Join Our Telegram Group
")


