#NZDUSD @ 0.62254 is looking to recapture the immediate resistance of 0.6230 amid the risk-on mood. (Pivot Orderbook analysis)
…
This is a premium post.
[s2If !current_user_can(access_s2member_level4)]Please register for PREMIUM VERSION HERE to read full post below containing analysis. In case of any error or you think you are not able to read the full post below, please email us at support#nehcap.com [lwa][/s2If] [s2If current_user_can(access_s2member_level4)]
- NZD/USD is looking to recapture the immediate resistance of 0.6230 amid the risk-on mood.
- The street is anticipating that weaker oil prices in March would result in further softening of US headline inflation.
- China’s CPI monthly figure would accelerate by 0.1% vs. a contraction of 0.5% reported earlier.
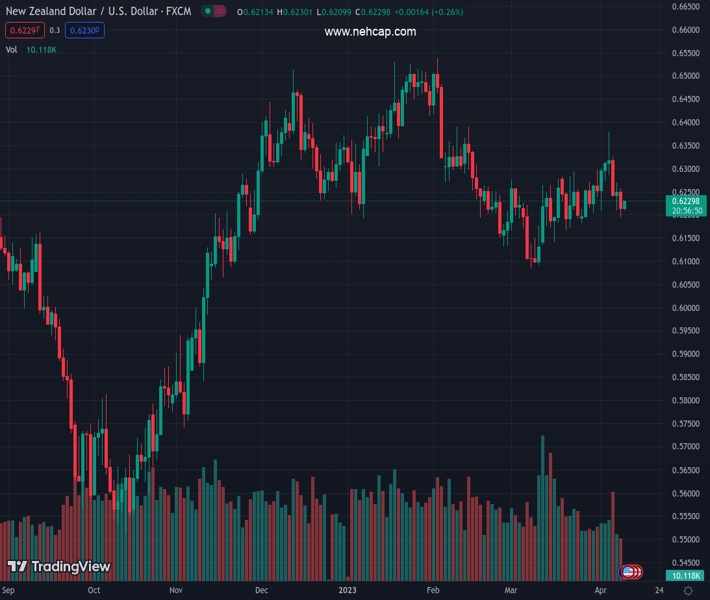
The pair currently trades last at 0.62254.
The previous day high was 0.6389 while the previous day low was 0.6209. The daily 38.2% Fib levels comes at 0.632, expected to provide resistance. Similarly, the daily 61.8% fib level is at 0.6278, expected to provide resistance.
The NZD/USD pair is looking to extend its recovery toward the immediate resistance of 0.6230 in the early Asian session. The Kiwi asset rebounded firmly after finding a stellar buying interest near the round-level support of 0.6200. The recovery move in the Kiwi asset was backed by a correction in the US Dollar Index (DXY) as investors started ignoring the risk associated with more rate hikes from the Federal Reserve (Fed) and shifted funds to risk-sensitive assets.
S&P500 futures have added some gains in the Asian session after a mild positive Monday. Gap down opening in US equities on Monday was fully offset by recovery. Also, investors ignored volatility ahead of the quarterly earnings season. Meanwhile, US yields scaled higher as investors are convinced about one more rate hike from the Federal Reserve (Fed) next month. The return offered o 10-year US Treasury yields rebounded firmly above 3.41%.
Going forward, the release of the United States inflation data will provide more clarity on Fed’s interest rate guidance. The street is anticipating that weaker oil prices in March would result in further softening of headline inflation. However, core inflation could be sticky further due to solid labor demand.
Economists at BBH expect “Headline inflation at 0.2% m/m and 5.1% y/y vs. 0.4% m/m and 6.0% y/y in February. A core is expected at 0.4% m/m and 5.6% y/y vs. 0.5% m/m and 5.5% y/y in February.”
On the New Zealand front, investors are awaiting the release of China’s inflation data. Annual inflation is expected to remain steady at 1% while the monthly figure would accelerate by 0.1% vs. a contraction of 0.5% reported earlier. This indicates that the retail demand is in a recovery mode, which will improve the overall economic outlook.
It is worth noting that New Zealand is one of the leading trading partners of China and the solidification of China’s economic prospects will also support the New Zealand Dollar.
Technical Levels: Supports and Resistances
NZDUSD currently trading at 0.6226 at the time of writing. Pair opened at 0.6268 and is trading with a change of -0.67 % .
| Overview | Overview.1 | |
|---|---|---|
| 0 | Today last price | 0.6226 |
| 1 | Today Daily Change | -0.0042 |
| 2 | Today Daily Change % | -0.6700 |
| 3 | Today daily open | 0.6268 |
The pair is trading below its 20 Daily moving average @ 0.6243, below its 50 Daily moving average @ 0.6259 , below its 100 Daily moving average @ 0.6302 and above its 200 Daily moving average @ 0.616
| Trends | Trends.1 | |
|---|---|---|
| 0 | Daily SMA20 | 0.6243 |
| 1 | Daily SMA50 | 0.6259 |
| 2 | Daily SMA100 | 0.6302 |
| 3 | Daily SMA200 | 0.6160 |
The previous day high was 0.6389 while the previous day low was 0.6209. The daily 38.2% Fib levels comes at 0.632, expected to provide resistance. Similarly, the daily 61.8% fib level is at 0.6278, expected to provide resistance.
Note the levels of interest below:
- Pivot support is noted at 0.6188, 0.6108, 0.6008
- Pivot resistance is noted at 0.6369, 0.6469, 0.6549
| Levels | Levels.1 |
|---|---|
| Previous Daily High | 0.6389 |
| Previous Daily Low | 0.6209 |
| Previous Weekly High | 0.6389 |
| Previous Weekly Low | 0.6207 |
| Previous Monthly High | 0.6298 |
| Previous Monthly Low | 0.6084 |
| Daily Fibonacci 38.2% | 0.6320 |
| Daily Fibonacci 61.8% | 0.6278 |
| Daily Pivot Point S1 | 0.6188 |
| Daily Pivot Point S2 | 0.6108 |
| Daily Pivot Point S3 | 0.6008 |
| Daily Pivot Point R1 | 0.6369 |
| Daily Pivot Point R2 | 0.6469 |
| Daily Pivot Point R3 | 0.6549 |
[/s2If]
Join Our Telegram Group
")


