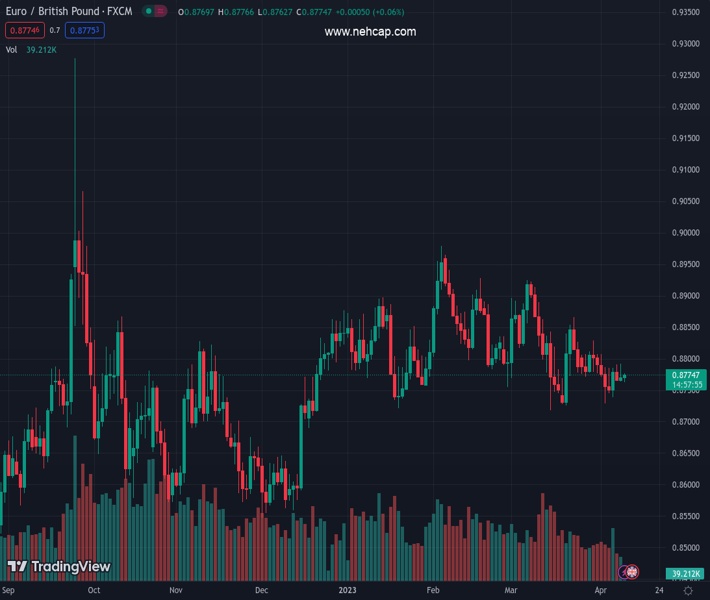
#EURGBP @ 0.87745 Price Analysis: Bears struggle to keep the reins below 0.8800, @nehcap view: Further upside expected (Pivot Orderbook analysis)
…
This is a premium post.
[s2If !current_user_can(access_s2member_level4)]Please register for PREMIUM VERSION HERE to read full post below containing analysis. In case of any error or you think you are not able to read the full post below, please email us at support#nehcap.com [lwa][/s2If] [s2If current_user_can(access_s2member_level4)]
- EUR/GBP Price Analysis: Bears struggle to keep the reins below 0.8800
- EUR/GBP remains sidelined after reversing from 100-SMA, one-month-old resistance line.
- One-week-old ascending trend line, sluggish MACD signals restrict downside moves.
- Bulls need validation from 200-SMA to retake control.
The pair currently trades last at 0.87745.
The previous day high was 0.8792 while the previous day low was 0.8765. The daily 38.2% Fib levels comes at 0.8775, expected to provide resistance. Similarly, the daily 61.8% fib level is at 0.8781, expected to provide resistance.
EUR/GBP treads water around 0.8775 heading into Tuesday’s London open, following a pullback from the short-term key technical hurdles the previous day.
Even so, the cross-currency pair’s sustained trading past a one-week-long ascending trend line joins sluggish MACD signals and steady RSI (14) to prod the bears.
As a result, a slower grind towards a downward-sloping resistance line from early March, around 0.8785, can’t be ruled out. However, the 100-SMA level of 0.8790, and the 0.8800 round figure could challenge the EUR/GBP bulls afterward.
In a case where the quote rises past 0.8800, the 200-SMA level of 0.8811 acts as the last defense of the bears, a break of which can propel the prices towards the late March swing high of around 0.8865.
On the flip side, the aforementioned one-week-old ascending support line, near 0.8755 by the press time, limits immediate declines of the EUR/GBP.
Following that, an ascending support line from March 15, close to 0.8730, becomes crucial to watch as a break of which won’t hesitate to challenge the Year-To-Date (YTD) low of 0.8718 marked in March.
Overall, EUR/GBP is likely to grind higher but the upside room remains limited.
Trend: Further upside expected
Technical Levels: Supports and Resistances
EURGBP currently trading at 0.8773 at the time of writing. Pair opened at 0.8772 and is trading with a change of 0.01% % .
| Overview | Overview.1 | |
|---|---|---|
| 0 | Today last price | 0.8773 |
| 1 | Today Daily Change | 0.0001 |
| 2 | Today Daily Change % | 0.01% |
| 3 | Today daily open | 0.8772 |
The pair is trading below its 20 Daily moving average @ 0.8787, below its 50 Daily moving average @ 0.8832 , below its 100 Daily moving average @ 0.8784 and above its 200 Daily moving average @ 0.8699
| Trends | Trends.1 | |
|---|---|---|
| 0 | Daily SMA20 | 0.8787 |
| 1 | Daily SMA50 | 0.8832 |
| 2 | Daily SMA100 | 0.8784 |
| 3 | Daily SMA200 | 0.8699 |
The previous day high was 0.8792 while the previous day low was 0.8765. The daily 38.2% Fib levels comes at 0.8775, expected to provide resistance. Similarly, the daily 61.8% fib level is at 0.8781, expected to provide resistance.
Note the levels of interest below:
- Pivot support is noted at 0.876, 0.8749, 0.8734
- Pivot resistance is noted at 0.8787, 0.8803, 0.8814
| Levels | Levels.1 |
|---|---|
| Previous Daily High | 0.8792 |
| Previous Daily Low | 0.8765 |
| Previous Weekly High | 0.8807 |
| Previous Weekly Low | 0.8729 |
| Previous Monthly High | 0.8925 |
| Previous Monthly Low | 0.8718 |
| Daily Fibonacci 38.2% | 0.8775 |
| Daily Fibonacci 61.8% | 0.8781 |
| Daily Pivot Point S1 | 0.8760 |
| Daily Pivot Point S2 | 0.8749 |
| Daily Pivot Point S3 | 0.8734 |
| Daily Pivot Point R1 | 0.8787 |
| Daily Pivot Point R2 | 0.8803 |
| Daily Pivot Point R3 | 0.8814 |
[/s2If]
Join Our Telegram Group
")


