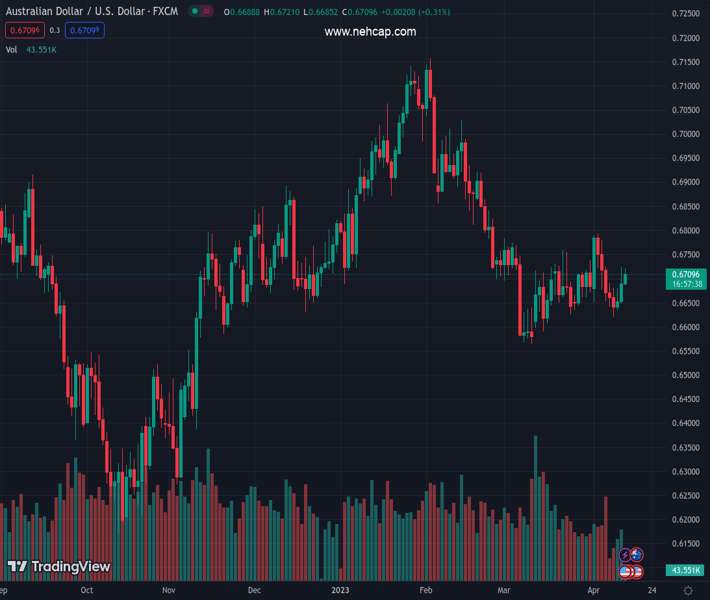
#AUDUSD @ 0.66737 bounces off three-week low amid upbeat catalysts surrounding Australia, grinds higher around intraday top of late. (Pivot Orderbook analysis)
…
This is a premium post.
[s2If !current_user_can(access_s2member_level4)]Please register for PREMIUM VERSION HERE to read full post below containing analysis. In case of any error or you think you are not able to read the full post below, please email us at support#nehcap.com [lwa][/s2If] [s2If current_user_can(access_s2member_level4)]
- AUD/USD bounces off three-week low amid upbeat catalysts surrounding Australia, grinds higher around intraday top of late.
- Australia Westpac Consumer Confidence, NAB sentiment figures join deal with China over barley exports to propel Aussie prices.
- Cautious optimism, reassessment of latest hawkish Fed bets challenge US Dollar bulls amid full markets.
- Risk catalysts eyed for fresh impulse ahead of top-tier US, Australia catalysts.
The pair currently trades last at 0.66737.
The previous day high was 0.668 while the previous day low was 0.662. The daily 38.2% Fib levels comes at 0.6643, expected to provide support. Similarly, the daily 61.8% fib level is at 0.6657, expected to provide support.
AUD/USD bulls are back in motion, after a week-long absence, as upbeat Aussie catalysts surrounding foreign trade and sentiment underpin the quote’s latest recovery from a three-week low to 0.6670 heading into Tuesday’s European session. Not only the price-positive factors surrounding Australia but the overall improvement in the risk appetite also favors the quote’s latest rebound.
That said, Australia’s Westpac Consumer Confidence for April rallied to the highest levels since June 2022, printing 9.4% figure versus 0.8% expected and 0.0% prior. Further, the National Australia Bank’s (NAB) Business Conditions matched the forecast figure of 16.0, versus 17.0 prior, whereas NAB Business Confidence eased to -1.0 versus 0.0% expected and -4.0% previous readings.
On the contrary, China’s headline inflation numbers for March, namely the Consumer Price Index (CPI) and Producer Price Index (PPI), came in 0.7% YoY and -2.5% YoY versus 1.0% and -1.4% respective priors.
Apart from mostly upbeat Aussie data, headlines from Reuters suggesting an end of the trade dispute between Australia and China over barley exports also seemed to have favored the AUD/USD prices.
Elsewhere, fresh doubts on the US Federal Reserve’s (Fed) capacity to stay hawkish, backed by downbeat comments from New York Fed John Williams and fears of recession spread by BlackRock, seem to weigh on the US Dollar and allow the AUD/USD to remain firmer.
Amid these plays, the S&P 500 Futures print mild gains around 4,143 at the latest while the US 10-year and two-year Treasury bond yields retreat to 3.40% and 3.97% by the press time.
Moving on, risk catalysts and the return of full markets may entertain AUD/USD pair traders ahead of Wednesday’s key US inflation and Fed Minutes, as well as Thursday’s Aussie jobs report.
AUD/USD bounces off a two-week-old support line, around 0.6620 at the latest, to aim for the convergence of the 10-DMA and the support-turned-resistance line stretched from March 10, around the 0.6700 round figure.
Technical Levels: Supports and Resistances
AUDUSD currently trading at 0.6668 at the time of writing. Pair opened at 0.6641 and is trading with a change of 0.41% % .
| Overview | Overview.1 | |
|---|---|---|
| 0 | Today last price | 0.6668 |
| 1 | Today Daily Change | 0.0027 |
| 2 | Today Daily Change % | 0.41% |
| 3 | Today daily open | 0.6641 |
The pair remains strongly bearish on the daily time frame. It trades below the 20 SMA @ 0.6687, 50 SMA 0.6775, 100 SMA @ 0.68 and 200 SMA @ 0.6746.
| Trends | Trends.1 | |
|---|---|---|
| 0 | Daily SMA20 | 0.6687 |
| 1 | Daily SMA50 | 0.6775 |
| 2 | Daily SMA100 | 0.6800 |
| 3 | Daily SMA200 | 0.6746 |
The previous day high was 0.668 while the previous day low was 0.662. The daily 38.2% Fib levels comes at 0.6643, expected to provide support. Similarly, the daily 61.8% fib level is at 0.6657, expected to provide support.
Note the levels of interest below:
- Pivot support is noted at 0.6614, 0.6587, 0.6554
- Pivot resistance is noted at 0.6674, 0.6707, 0.6734
| Levels | Levels.1 |
|---|---|
| Previous Daily High | 0.6680 |
| Previous Daily Low | 0.6620 |
| Previous Weekly High | 0.6793 |
| Previous Weekly Low | 0.6641 |
| Previous Monthly High | 0.6784 |
| Previous Monthly Low | 0.6564 |
| Daily Fibonacci 38.2% | 0.6643 |
| Daily Fibonacci 61.8% | 0.6657 |
| Daily Pivot Point S1 | 0.6614 |
| Daily Pivot Point S2 | 0.6587 |
| Daily Pivot Point S3 | 0.6554 |
| Daily Pivot Point R1 | 0.6674 |
| Daily Pivot Point R2 | 0.6707 |
| Daily Pivot Point R3 | 0.6734 |
[/s2If]
Join Our Telegram Group
")


