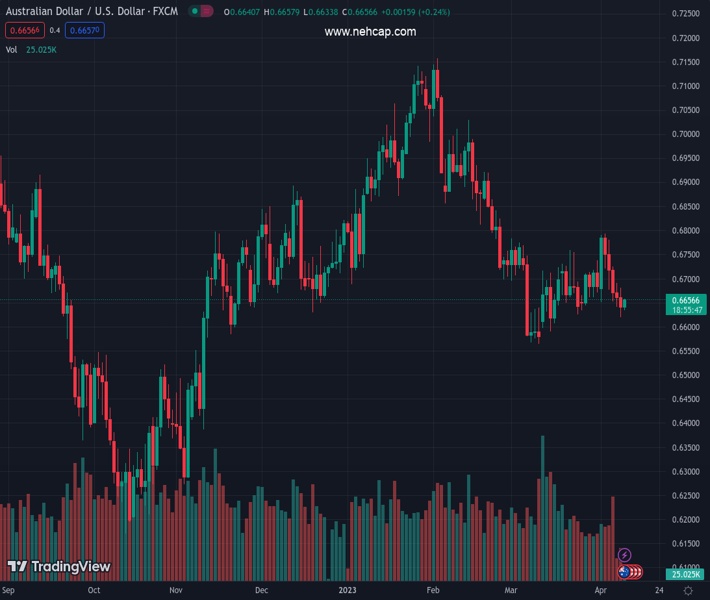
#AUDUSD @ 0.66559 drops sharply below 0.6650 amid a recovery in USD Index and China’s deflationary data. (Pivot Orderbook analysis)
…
This is a premium post.
[s2If !current_user_can(access_s2member_level4)]Please register for PREMIUM VERSION HERE to read full post below containing analysis. In case of any error or you think you are not able to read the full post below, please email us at support#nehcap.com [lwa][/s2If] [s2If current_user_can(access_s2member_level4)]
- AUD/USD drops sharply below 0.6650 amid a recovery in USD Index and China’s deflationary data.
- Annual China inflation data has softened to 0.7% from the consensus and the former release of 1.0%.
- The USD Index has shown recovery as fears of a further rate hike from the Fed have renewed.
The pair currently trades last at 0.66559.
The previous day high was 0.668 while the previous day low was 0.662. The daily 38.2% Fib levels comes at 0.6643, expected to provide support. Similarly, the daily 61.8% fib level is at 0.6657, expected to provide resistance.
The AUD/USD pair has slipped below 0.6650 as China’s Consumer Price Index (CPI) has softened further despite various measures from the Chinese administration to stem economic recovery. Annual China inflation data has softened to 0.7% from the consensus and the former release of 1.0%. On a monthly basis, the Chinese economy has shown deflation by 0.3% while the street was expecting an acceleration in prices of goods and services by 0.1%.
This indicates poor demand from households, which is raising questions about the economic prospects of the Chinese economy despite reopening with various stimulus. It is worth noting that Australia is the leading trading partner of China and weaker Chinese economic prospects will also dampen the Australian Dollar.
This week, the Australian Dollar will remain in action amid the release of March’s Employment data, which will release on Thursday. The street is anticipating an addition of fresh 20K jobs in the Australian economy lower than the former release of 64.6K. While the Unemployment Rate is expected to increase to 3.6% vs. 3.5% released in February.
A slowdown in the labor demand should be the outcome of higher rates from the Reserve Bank of Australia (RBA). RBA Governor Philip Lowe has already commented that the Australian economy will slow further due to higher interest rates and inflation will soften too. Easing labor market conditions would be supportive of the RBA in maintaining its monetary policy unchanged.
Meanwhile, S&P500 futures are showing choppy moves with some positive bias from the previous trading session, indicating minor strength in bulls in a quiet market. The US Dollar Index (DXY) has shown a recovery move after an extended correction to near 102.40.
Going forward, the release of the United States inflation data will guide the further direction in market. As per the consensus, the headline inflation will soften to 5.2% from the former release of 6.0%. Also, monthly headline CPI would decelerate to 0.3% from 0.4% reported earlier. While annual core inflation that excludes oil and food prices could surprisingly jump to 5.6% from the former release of 5.5%.
Technical Levels: Supports and Resistances
AUDUSD currently trading at 0.665 at the time of writing. Pair opened at 0.6641 and is trading with a change of 0.14 % .
| Overview | Overview.1 | |
|---|---|---|
| 0 | Today last price | 0.6650 |
| 1 | Today Daily Change | 0.0009 |
| 2 | Today Daily Change % | 0.1400 |
| 3 | Today daily open | 0.6641 |
The pair remains strongly bearish on the daily time frame. It trades below the 20 SMA @ 0.6687, 50 SMA 0.6775, 100 SMA @ 0.68 and 200 SMA @ 0.6746.
| Trends | Trends.1 | |
|---|---|---|
| 0 | Daily SMA20 | 0.6687 |
| 1 | Daily SMA50 | 0.6775 |
| 2 | Daily SMA100 | 0.6800 |
| 3 | Daily SMA200 | 0.6746 |
The previous day high was 0.668 while the previous day low was 0.662. The daily 38.2% Fib levels comes at 0.6643, expected to provide support. Similarly, the daily 61.8% fib level is at 0.6657, expected to provide resistance.
Note the levels of interest below:
- Pivot support is noted at 0.6614, 0.6587, 0.6554
- Pivot resistance is noted at 0.6674, 0.6707, 0.6734
| Levels | Levels.1 |
|---|---|
| Previous Daily High | 0.6680 |
| Previous Daily Low | 0.6620 |
| Previous Weekly High | 0.6793 |
| Previous Weekly Low | 0.6641 |
| Previous Monthly High | 0.6784 |
| Previous Monthly Low | 0.6564 |
| Daily Fibonacci 38.2% | 0.6643 |
| Daily Fibonacci 61.8% | 0.6657 |
| Daily Pivot Point S1 | 0.6614 |
| Daily Pivot Point S2 | 0.6587 |
| Daily Pivot Point S3 | 0.6554 |
| Daily Pivot Point R1 | 0.6674 |
| Daily Pivot Point R2 | 0.6707 |
| Daily Pivot Point R3 | 0.6734 |
[/s2If]
Join Our Telegram Group
")


