#AUDUSD @ 0.66513 recovers from the lowest levels in 12 days to snap five-day downtrend., @nehcap view: Further downside expected (Pivot Orderbook analysis)
…
This is a premium post.
[s2If !current_user_can(access_s2member_level4)]Please register for PREMIUM VERSION HERE to read full post below containing analysis. In case of any error or you think you are not able to read the full post below, please email us at support#nehcap.com [lwa][/s2If] [s2If current_user_can(access_s2member_level4)]
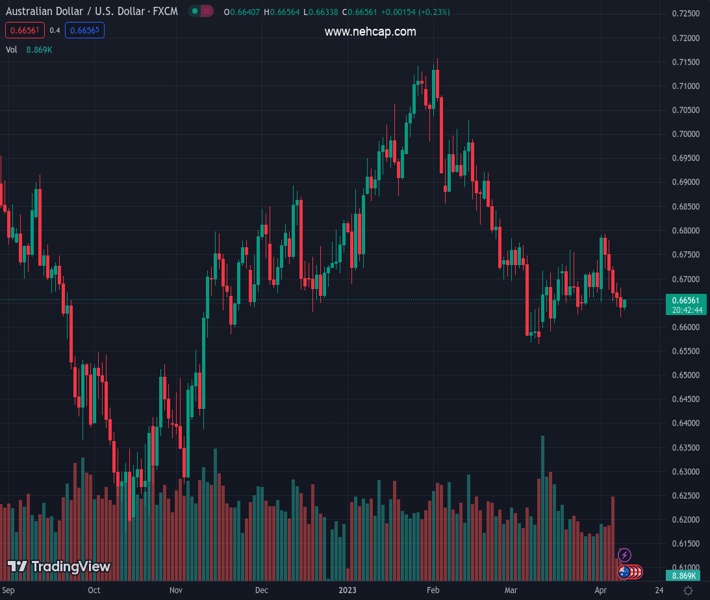
- AUD/USD recovers from the lowest levels in 12 days to snap five-day downtrend.
- Convergence of 10-DMA, previous support line from early March restricts immediate upside.
- Aussie bulls need validation from 0.6800 to keep the reins.
The pair currently trades last at 0.66513.
The previous day high was 0.668 while the previous day low was 0.662. The daily 38.2% Fib levels comes at 0.6672, expected to provide resistance. Similarly, the daily 61.8% fib level is at 0.666, expected to provide resistance.
AUD/USD picks up bids to pare recent losses around 0.6650 during early Tuesday morning in Asia. In doing so, the Aussie pair rebounds from the lowest levels in two weeks while taking a U-turn from the 12-day-old horizontal support around 0.6620.
However, the looming bearish MACD signals and the steady RSI suggests further downside for the AUD/USD pair.
Also challenging the quote’s latest recovery moves could be the convergence of the 10-DMA and the support-turned-resistance line stretched from March 10, around the 0.6700 round figure.
Even if the AUD/USD bulls manage to cross the 0.6700 hurdle the 50% Fibonacci retracement level of the pair’s February-March fall, around 0.6805 will act as the last defense of the bears.
Alternatively, a downside break of 0.6620 could trigger the fresh fall targeting the YTD low marked in February around 0.6565.
Trend: Further downside expected
Technical Levels: Supports and Resistances
AUDUSD currently trading at 0.6648 at the time of writing. Pair opened at 0.6641 and is trading with a change of 0.11 % .
| Overview | Overview.1 | |
|---|---|---|
| 0 | Today last price | 0.6648 |
| 1 | Today Daily Change | 0.0007 |
| 2 | Today Daily Change % | 0.1100 |
| 3 | Today daily open | 0.6641 |
The pair remains strongly bearish on the daily time frame. It trades below the 20 SMA @ 0.6687, 50 SMA 0.6775, 100 SMA @ 0.68 and 200 SMA @ 0.6746.
| Trends | Trends.1 | |
|---|---|---|
| 0 | Daily SMA20 | 0.6687 |
| 1 | Daily SMA50 | 0.6775 |
| 2 | Daily SMA100 | 0.6800 |
| 3 | Daily SMA200 | 0.6746 |
The previous day high was 0.668 while the previous day low was 0.662. The daily 38.2% Fib levels comes at 0.6672, expected to provide resistance. Similarly, the daily 61.8% fib level is at 0.666, expected to provide resistance.
Note the levels of interest below:
- Pivot support is noted at 0.6646, 0.6618, 0.6596
- Pivot resistance is noted at 0.6696, 0.6719, 0.6746
| Levels | Levels.1 |
|---|---|
| Previous Daily High | 0.6680 |
| Previous Daily Low | 0.6620 |
| Previous Weekly High | 0.6793 |
| Previous Weekly Low | 0.6641 |
| Previous Monthly High | 0.6784 |
| Previous Monthly Low | 0.6564 |
| Daily Fibonacci 38.2% | 0.6672 |
| Daily Fibonacci 61.8% | 0.6660 |
| Daily Pivot Point S1 | 0.6646 |
| Daily Pivot Point S2 | 0.6618 |
| Daily Pivot Point S3 | 0.6596 |
| Daily Pivot Point R1 | 0.6696 |
| Daily Pivot Point R2 | 0.6719 |
| Daily Pivot Point R3 | 0.6746 |
[/s2If]
Join Our Telegram Group
")


