#XAGUSD @ 24.863 Silver price stays depressed after downbeat week-start, grinds near highest levels in a year., @nehcap view: Further downside expected (Pivot Orderbook analysis)
…
This is a premium post.
[s2If !current_user_can(access_s2member_level4)]Please register for PREMIUM VERSION HERE to read full post below containing analysis. In case of any error or you think you are not able to read the full post below, please email us at support#nehcap.com [lwa][/s2If] [s2If current_user_can(access_s2member_level4)]
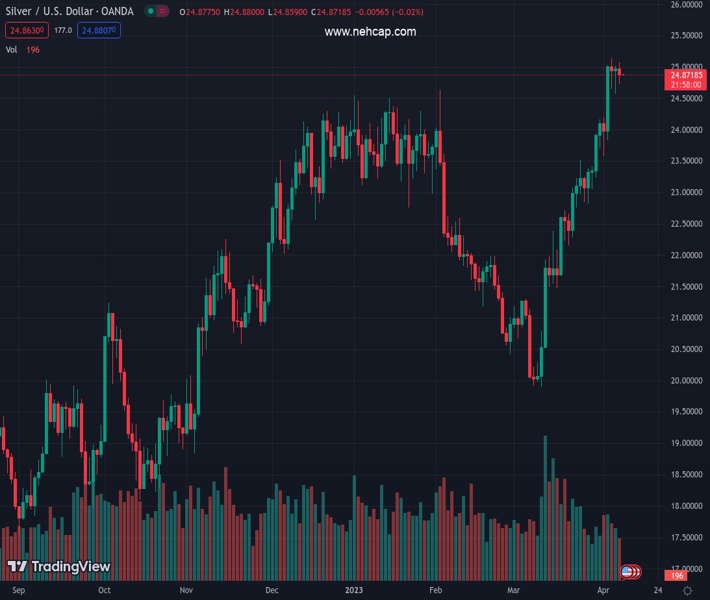
- Silver price stays depressed after downbeat week-start, grinds near highest levels in a year.
- Overbought RSI conditions, receding bullish bias of MACD signals lure bears.
- Failure to cross ascending resistance line from late 2022 adds strength to bearish bias.
- Multiple support lines from March restrict immediate downside ahead of highlighting 100-DMA support.
The pair currently trades last at 24.863.
The previous day high was 25.0 while the previous day low was 24.56. The daily 38.2% Fib levels comes at 24.84, expected to provide support. Similarly, the daily 61.8% fib level is at 24.73, expected to provide support.
Silver price (XAG/USD) makes rounds to $24.80-85 during the early hours of Tuesday’s Asian session, following a downbeat start of the week. Even so, the bright metal seesaws around the highest levels since late April 2022 marked in the last week.
That said, the commodity buyers appear running out of steam of late as the RSI (14) turns over overbought and the MACD signals also retreat within the bullish area.
Adding strength to the downside bias is the XAG/USD’s failure to cross an upward-sloping resistance line from late December 2022, close to $25.15 by the press time.
However, two ascending support lines from the previous month, respectively near $24.65 and $24.30, restrict the short-term downside of the Silver price.
Following that, the precious metal’s slump towards the $21.80-75 support zone comprising January’s low and the 100-DMA can’t be ruled out.
Meanwhile, an upside clearance of the aforementioned resistance line, close to $25.15, opens the door for the XAG/USD rally towards the April 2022 peak of $26.22.
In a case where the Silver buyers keep the reins past $26.22, the previous yearly high of around $26.95 and the $27.00 round figure will gain the market’s attention.
Trend: Further downside expected
Technical Levels: Supports and Resistances
XAGUSD currently trading at 24.85 at the time of writing. Pair opened at 24.97 and is trading with a change of -0.48% % .
| Overview | Overview.1 | |
|---|---|---|
| 0 | Today last price | 24.85 |
| 1 | Today Daily Change | -0.12 |
| 2 | Today Daily Change % | -0.48% |
| 3 | Today daily open | 24.97 |
The pair remains strongly bullish on the daily timeframe. It trades above its 20 SMA @ 23.05, 50 SMA 22.29, 100 SMA @ 22.72 and 200 SMA @ 21.11.
| Trends | Trends.1 | |
|---|---|---|
| 0 | Daily SMA20 | 23.05 |
| 1 | Daily SMA50 | 22.29 |
| 2 | Daily SMA100 | 22.72 |
| 3 | Daily SMA200 | 21.11 |
The previous day high was 25.0 while the previous day low was 24.56. The daily 38.2% Fib levels comes at 24.84, expected to provide support. Similarly, the daily 61.8% fib level is at 24.73, expected to provide support.
Note the levels of interest below:
- Pivot support is noted at 24.69, 24.41, 24.25
- Pivot resistance is noted at 25.13, 25.29, 25.57
| Levels | Levels.1 |
|---|---|
| Previous Daily High | 25.00 |
| Previous Daily Low | 24.56 |
| Previous Weekly High | 25.14 |
| Previous Weekly Low | 23.57 |
| Previous Monthly High | 24.16 |
| Previous Monthly Low | 19.90 |
| Daily Fibonacci 38.2% | 24.84 |
| Daily Fibonacci 61.8% | 24.73 |
| Daily Pivot Point S1 | 24.69 |
| Daily Pivot Point S2 | 24.41 |
| Daily Pivot Point S3 | 24.25 |
| Daily Pivot Point R1 | 25.13 |
| Daily Pivot Point R2 | 25.29 |
| Daily Pivot Point R3 | 25.57 |
[/s2If]
Join Our Telegram Group
")


