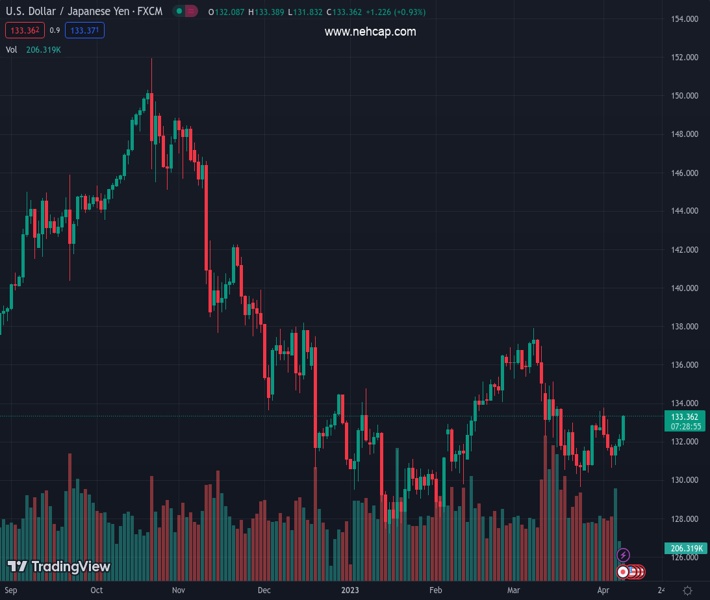
#USDJPY @ 133.360 rallies to a one-week high and draws support from a combination of factors. (Pivot Orderbook analysis)
…
This is a premium post.
[s2If !current_user_can(access_s2member_level4)]Please register for PREMIUM VERSION HERE to read full post below containing analysis. In case of any error or you think you are not able to read the full post below, please email us at support#nehcap.com [lwa][/s2If] [s2If current_user_can(access_s2member_level4)]
- USD/JPY rallies to a one-week high and draws support from a combination of factors.
- Reviving bets for a 25 bps Fed rate hike in May boosts the USD and acts as a tailwind.
- Dovish remarks by the new BoJ Governor also contribute to the strong intraday rise.
The pair currently trades last at 133.360.
The previous day high was 132.38 while the previous day low was 131.53. The daily 38.2% Fib levels comes at 132.05, expected to provide support. Similarly, the daily 61.8% fib level is at 131.85, expected to provide support.
The USD/JPY pair scales higher for the third successive day on Monday and touches a one-week high heading into the North American session. The pair is currently placed around the 133.30 mark, up nearly 0.90% for the day, with bulls now eyeing to challenge the 100-day Simple Moving Average (SMA) barrier amid broad-based US Dollar (USD) strength.
In fact, the USD Index, which tracks the Greenback against a basket of currencies, builds on last week’s recovery move from over a two-month low and gains strong follow-through traction amid expectations for further rate hikes by the Federal Reserve (Fed). The markets are now pricing in a greater chance of a 25 bps lift-off at the next FOMC policy meeting in May and the bets were lifted by the mostly upbeat US monthly employment details released on Friday. This, in turn, continues to push the USD higher, which, along with dovish-sounding remarks by the new Bank of Japan (BoJ) Governor
Kazuo Ueda, prompt aggressive short-covering around the USD/JPY pair.
During his inauguration speech, Ueda ruled out any major policy shift and said that they want to avoid a sudden normalisation in monetary policy as it would cause a big impact on markets. This, in turn, weighs heavily on the Japanese Yen (JPY) and provides an additional boost to the USD/JPY pair. That said, the risk-off impulse – as depicted by a fresh leg down in the equity markets – could lend some support to the safe-haven JPY and keep a lid on any further gains for the major, at least for the time being. Against the backdrop of worries about a deeper global economic downturn, heightened US-China tensions over Taiwan tempers investors’ appetite for riskier assets.
This makes it prudent to wait for a sustained break through the 100-day SMA before positioning for any further appreciating move ahead of the US consumer inflation figures and the FOMC meeting minutes, due for release on Wednesday. Apart from this, traders will take cues from the US monthly Retail Sales figures on Friday. This will play a key role in influencing the near-term USD price dynamics and help determine the next leg of a directional move for the USD/JPY pair.
Technical Levels: Supports and Resistances
USDJPY currently trading at 133.33 at the time of writing. Pair opened at 132.17 and is trading with a change of 0.88 % .
| Overview | Overview.1 | |
|---|---|---|
| 0 | Today last price | 133.33 |
| 1 | Today Daily Change | 1.16 |
| 2 | Today Daily Change % | 0.88 |
| 3 | Today daily open | 132.17 |
The pair is trading above its 20 Daily moving average @ 132.17, above its 50 Daily moving average @ 133.12 , below its 100 Daily moving average @ 133.48 and below its 200 Daily moving average @ 137.22
| Trends | Trends.1 | |
|---|---|---|
| 0 | Daily SMA20 | 132.17 |
| 1 | Daily SMA50 | 133.12 |
| 2 | Daily SMA100 | 133.48 |
| 3 | Daily SMA200 | 137.22 |
The previous day high was 132.38 while the previous day low was 131.53. The daily 38.2% Fib levels comes at 132.05, expected to provide support. Similarly, the daily 61.8% fib level is at 131.85, expected to provide support.
Note the levels of interest below:
- Pivot support is noted at 131.67, 131.17, 130.82
- Pivot resistance is noted at 132.52, 132.87, 133.37
| Levels | Levels.1 |
|---|---|
| Previous Daily High | 132.38 |
| Previous Daily Low | 131.53 |
| Previous Weekly High | 133.76 |
| Previous Weekly Low | 130.63 |
| Previous Monthly High | 137.91 |
| Previous Monthly Low | 129.64 |
| Daily Fibonacci 38.2% | 132.05 |
| Daily Fibonacci 61.8% | 131.85 |
| Daily Pivot Point S1 | 131.67 |
| Daily Pivot Point S2 | 131.17 |
| Daily Pivot Point S3 | 130.82 |
| Daily Pivot Point R1 | 132.52 |
| Daily Pivot Point R2 | 132.87 |
| Daily Pivot Point R3 | 133.37 |
[/s2If]
Join Our Telegram Group
")


