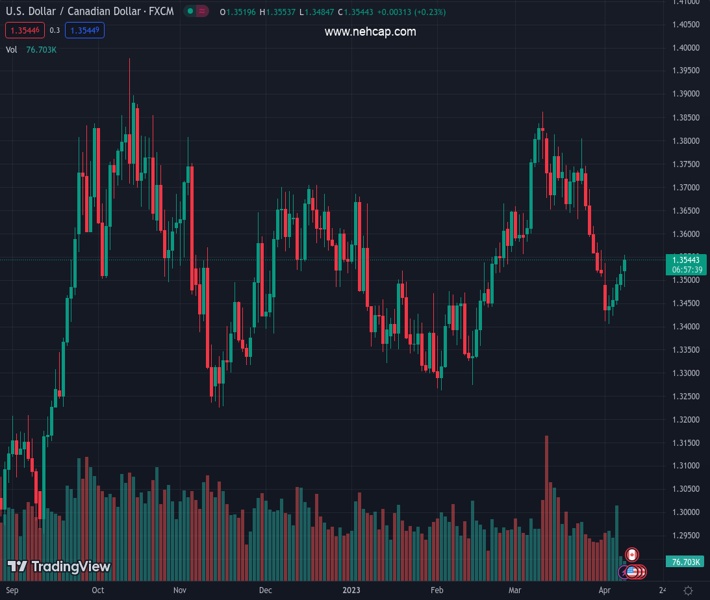
#USDCAD @ 1.35518 turns positive for the fifth straight day and rallies to over a one-week high. (Pivot Orderbook analysis)
…
This is a premium post.
[s2If !current_user_can(access_s2member_level4)]Please register for PREMIUM VERSION HERE to read full post below containing analysis. In case of any error or you think you are not able to read the full post below, please email us at support#nehcap.com [lwa][/s2If] [s2If current_user_can(access_s2member_level4)]
- USD/CAD turns positive for the fifth straight day and rallies to over a one-week high.
- A combination of factors boosts the USD and remains supportive of the intraday rally.
- Subdued Oil prices fail to influence the Loonie or hinder the ongoing recovery move.
The pair currently trades last at 1.35518.
The previous day high was 1.3531 while the previous day low was 1.3478. The daily 38.2% Fib levels comes at 1.3511, expected to provide support. Similarly, the daily 61.8% fib level is at 1.3498, expected to provide support.
The USD/CAD pair attracts fresh buyers following an intraday dip to the 1.3485 region and turns positive for the fifth successive day on Monday. The intraday uptick is sponsored by the emergence of aggressive US Dollar (USD) buying and lifts spot prices to over a one-week high, around the 1.3555 region in the last hour.
Against the backdrop of reviving bets for further tightening by the Federal Reserve (Fed), the risk-off impulse boosts demand for the safe-haven USD and assists the USD/CAD pair to build on last week’s rebound from the 1.3400 mark, or its lowest level since February 16. In fact, the markets are now pricing in a greater chance of a 25 bps lift-off at the next FOMC meeting in May and the bets were reaffirmed by the mostly upbeat US monthly jobs report (NFP) released on Friday.
The global risk sentiment, meanwhile, took a hit in the wake of heightening US-China tensions over Taiwan. This is evident from a fresh leg down in the equity markets, which, in turn, forces investors to take refuge in traditional safe-haven assets, including the Greenback. Furthermore, subdued action around Crude Oil prices, despite looming supply cuts from OPEC+, fails to benefit the commodity-linked Loonie. This supports prospects for a further appreciating move for the USD/CAD pair, though traders might refrain from placing fresh bets ahead of this week’s key central bank event risks.
The Bank of Canada (BoC) is scheduled to announce its policy decision on Wednesday and will be accompanied by the latest US consumer inflation figures. This will be followed by the release of the FOMC meeting minutes, which will play a key role in influencing the USD price dynamics and provide a fresh directional impetus to the USD/CAD pair. Traders will further take cues from the release of the US monthly Retail Sales figures on Friday. In the meantime, expectations that the Fed is nearing the end of its rate-hiking cycle could cap the buck and act as a headwind for the major.
Technical Levels: Supports and Resistances
USDCAD currently trading at 1.3542 at the time of writing. Pair opened at 1.3516 and is trading with a change of 0.19 % .
| Overview | Overview.1 | |
|---|---|---|
| 0 | Today last price | 1.3542 |
| 1 | Today Daily Change | 0.0026 |
| 2 | Today Daily Change % | 0.1900 |
| 3 | Today daily open | 1.3516 |
The pair is trading below its 20 Daily moving average @ 1.3621, below its 50 Daily moving average @ 1.3555 , above its 100 Daily moving average @ 1.3529 and above its 200 Daily moving average @ 1.339
| Trends | Trends.1 | |
|---|---|---|
| 0 | Daily SMA20 | 1.3621 |
| 1 | Daily SMA50 | 1.3555 |
| 2 | Daily SMA100 | 1.3529 |
| 3 | Daily SMA200 | 1.3390 |
The previous day high was 1.3531 while the previous day low was 1.3478. The daily 38.2% Fib levels comes at 1.3511, expected to provide support. Similarly, the daily 61.8% fib level is at 1.3498, expected to provide support.
Note the levels of interest below:
- Pivot support is noted at 1.3486, 1.3456, 1.3433
- Pivot resistance is noted at 1.3539, 1.3561, 1.3592
| Levels | Levels.1 |
|---|---|
| Previous Daily High | 1.3531 |
| Previous Daily Low | 1.3478 |
| Previous Weekly High | 1.3537 |
| Previous Weekly Low | 1.3406 |
| Previous Monthly High | 1.3862 |
| Previous Monthly Low | 1.3508 |
| Daily Fibonacci 38.2% | 1.3511 |
| Daily Fibonacci 61.8% | 1.3498 |
| Daily Pivot Point S1 | 1.3486 |
| Daily Pivot Point S2 | 1.3456 |
| Daily Pivot Point S3 | 1.3433 |
| Daily Pivot Point R1 | 1.3539 |
| Daily Pivot Point R2 | 1.3561 |
| Daily Pivot Point R3 | 1.3592 |
[/s2If]
Join Our Telegram Group
")


