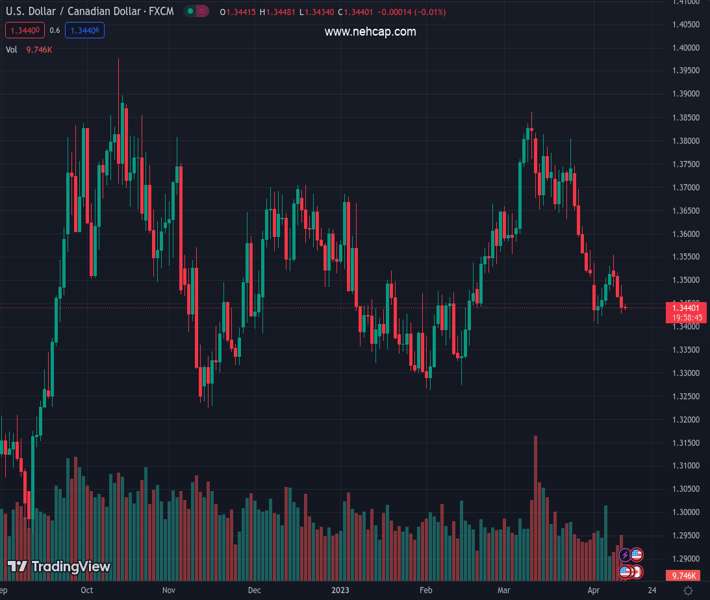
#USDCAD @ 1.35095 struggles to defend the first daily loss in five inside a bearish chart formation., @nehcap view: Limited upside expected (Pivot Orderbook analysis)
…
This is a premium post.
[s2If !current_user_can(access_s2member_level4)]Please register for PREMIUM VERSION HERE to read full post below containing analysis. In case of any error or you think you are not able to read the full post below, please email us at support#nehcap.com [lwa][/s2If] [s2If current_user_can(access_s2member_level4)]
- USD/CAD struggles to defend the first daily loss in five inside a bearish chart formation.
- Sustained trading beyond 50-SMA, firmer oscillators prod bears.
- 200-SMA appears crucial hurdle for Loonie pair buyers.
The pair currently trades last at 1.35095.
The previous day high was 1.3531 while the previous day low was 1.3478. The daily 38.2% Fib levels comes at 1.3511, expected to provide resistance. Similarly, the daily 61.8% fib level is at 1.3498, expected to provide support.
USD/CAD picks up bids to pare intraday losses around 1.3510, after snapping four-day uptrend earlier in Asia. In doing so, the Loonie pair bounces off the 50-bar Simple Moving Average (SMA) but stays within a two-week-old bear flag chart formation.
That said, the bullish MACD signals and the firmer RSI (14), not overbought, suggest the USD/CAD pair’s further upside towards challenging the stated bearish chart pattern, by poking the flag’s top line of near 1.3545 by the press time.
However, the quote’s further upside hinges on its ability to stay beyond 1.3545, as well as successful trading beyond the 200-SMA resistance of 1.3635.
In that case, the USD/CAD bulls can aim for the late September highs of around 1.3800 before targeting the previous monthly peak of 1.3861.
Meanwhile, the Loonie pair’s downside break of the 50-SMA, around 1.3500 by the press time, could recall the bears. Though, the sellers must conquer the 1.3485 key support, comprising the lower line of the stated flag, to retake control.
Following that, the latest bottom surrounding 1.3400 may act as an intermediate halt during the theoretical fall targeting 1.3100.
It should be noted that the lows marked in February, close to 1.3260, may act as an extra filter towards the south.
Trend: Limited upside expected
Technical Levels: Supports and Resistances
USDCAD currently trading at 1.351 at the time of writing. Pair opened at 1.3516 and is trading with a change of -0.04% % .
| Overview | Overview.1 | |
|---|---|---|
| 0 | Today last price | 1.351 |
| 1 | Today Daily Change | -0.0006 |
| 2 | Today Daily Change % | -0.04% |
| 3 | Today daily open | 1.3516 |
The pair is trading below its 20 Daily moving average @ 1.3621, below its 50 Daily moving average @ 1.3555 , below its 100 Daily moving average @ 1.3529 and above its 200 Daily moving average @ 1.339
| Trends | Trends.1 | |
|---|---|---|
| 0 | Daily SMA20 | 1.3621 |
| 1 | Daily SMA50 | 1.3555 |
| 2 | Daily SMA100 | 1.3529 |
| 3 | Daily SMA200 | 1.3390 |
The previous day high was 1.3531 while the previous day low was 1.3478. The daily 38.2% Fib levels comes at 1.3511, expected to provide resistance. Similarly, the daily 61.8% fib level is at 1.3498, expected to provide support.
Note the levels of interest below:
- Pivot support is noted at 1.3486, 1.3456, 1.3433
- Pivot resistance is noted at 1.3539, 1.3561, 1.3592
| Levels | Levels.1 |
|---|---|
| Previous Daily High | 1.3531 |
| Previous Daily Low | 1.3478 |
| Previous Weekly High | 1.3537 |
| Previous Weekly Low | 1.3406 |
| Previous Monthly High | 1.3862 |
| Previous Monthly Low | 1.3508 |
| Daily Fibonacci 38.2% | 1.3511 |
| Daily Fibonacci 61.8% | 1.3498 |
| Daily Pivot Point S1 | 1.3486 |
| Daily Pivot Point S2 | 1.3456 |
| Daily Pivot Point S3 | 1.3433 |
| Daily Pivot Point R1 | 1.3539 |
| Daily Pivot Point R2 | 1.3561 |
| Daily Pivot Point R3 | 1.3592 |
[/s2If]
Join Our Telegram Group
")


