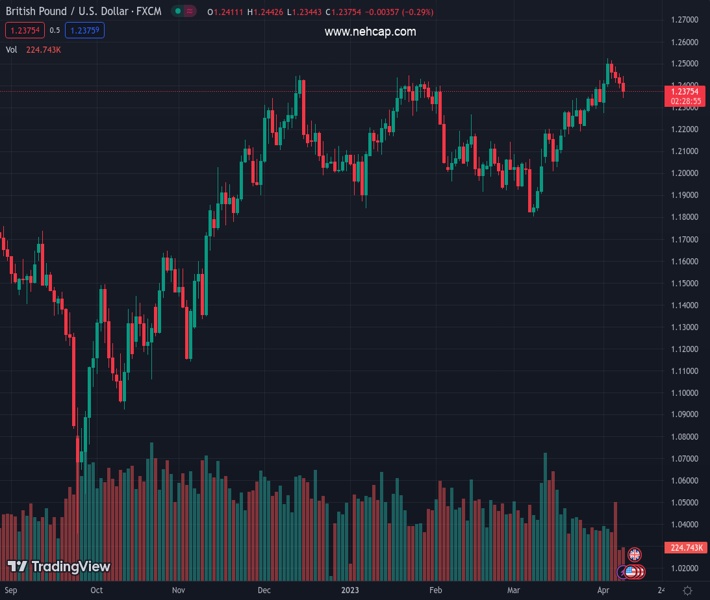
#GBPUSD @ 1.23763 The United Kingdom will release relevant macroeconomic figures next Thursday. (Pivot Orderbook analysis)
…
This is a premium post.
[s2If !current_user_can(access_s2member_level4)]Please register for PREMIUM VERSION HERE to read full post below containing analysis. In case of any error or you think you are not able to read the full post below, please email us at support#nehcap.com [lwa][/s2If] [s2If current_user_can(access_s2member_level4)]
- The United Kingdom will release relevant macroeconomic figures next Thursday.
- The American Dollar is rising on the back of a dismal market mood.
- GBP/USD is under selling pressure and could fall towards 1.2273.
The pair currently trades last at 1.23763.
The previous day high was 1.2456 while the previous day low was 1.2389. The daily 38.2% Fib levels comes at 1.2415, expected to provide resistance. Similarly, the daily 61.8% fib level is at 1.243, expected to provide resistance.
GBP/USD bounced modestly from an intraday low of 1.2343, now changing hands at around 1.2380. The pair edged sharply lower ahead of the US opening, despite the Eurozone and the United Kingdom celebrating Easter Monday, which kept local markets closed.
Wall Street, on the other hand, normally operated with US indexes trading mixed around their opening levels. The Dow Jones Industrial Average is up 0.14%, while the S&P 500 and the Nasdaq Composite remain in the red. Treasury yields, on the other hand, ticked north, with the 10-year note currently offering 3.41% and the 2-year note 4.0%.
The US Dollar advanced amid a dismal market mood, as market players are once again focused on a potential recession in the United States, following aggressive monetary tightening from the Federal Reserve (Fed) and the banking crisis that started last month.
The British Pound may find firmer directional strength on Thursday when the UK will release updates on the Gross Domestic Product, Industrial and Manufacturing Production, and the Trade Balance.
The GBP/USD pair is posting lower lows on a daily basis, in line with a bearish extension in the upcoming sessions, moreover, if the aforementioned daily low is infringed. The pair may then slide towards 1.2273, April 3 daily low, en route to 1.2189, March 24 low. Immediate resistance could be found in the 1.2440 region, with gains beyond it exposing the multi-week high set in early April at 1.2524.
Technical Levels: Supports and Resistances
GBPUSD currently trading at 1.2377 at the time of writing. Pair opened at 1.2418 and is trading with a change of -0.33 % .
| Overview | Overview.1 | |
|---|---|---|
| 0 | Today last price | 1.2377 |
| 1 | Today Daily Change | -0.0041 |
| 2 | Today Daily Change % | -0.3300 |
| 3 | Today daily open | 1.2418 |
The pair remains strongly bullish on the daily timeframe. It trades above its 20 SMA @ 1.2293, 50 SMA 1.2156, 100 SMA @ 1.2159 and 200 SMA @ 1.1902.
| Trends | Trends.1 | |
|---|---|---|
| 0 | Daily SMA20 | 1.2293 |
| 1 | Daily SMA50 | 1.2156 |
| 2 | Daily SMA100 | 1.2159 |
| 3 | Daily SMA200 | 1.1902 |
The previous day high was 1.2456 while the previous day low was 1.2389. The daily 38.2% Fib levels comes at 1.2415, expected to provide resistance. Similarly, the daily 61.8% fib level is at 1.243, expected to provide resistance.
Note the levels of interest below:
- Pivot support is noted at 1.2386, 1.2354, 1.2319
- Pivot resistance is noted at 1.2453, 1.2488, 1.252
| Levels | Levels.1 |
|---|---|
| Previous Daily High | 1.2456 |
| Previous Daily Low | 1.2389 |
| Previous Weekly High | 1.2525 |
| Previous Weekly Low | 1.2275 |
| Previous Monthly High | 1.2424 |
| Previous Monthly Low | 1.1803 |
| Daily Fibonacci 38.2% | 1.2415 |
| Daily Fibonacci 61.8% | 1.2430 |
| Daily Pivot Point S1 | 1.2386 |
| Daily Pivot Point S2 | 1.2354 |
| Daily Pivot Point S3 | 1.2319 |
| Daily Pivot Point R1 | 1.2453 |
| Daily Pivot Point R2 | 1.2488 |
| Daily Pivot Point R3 | 1.2520 |
[/s2If]
Join Our Telegram Group
")


