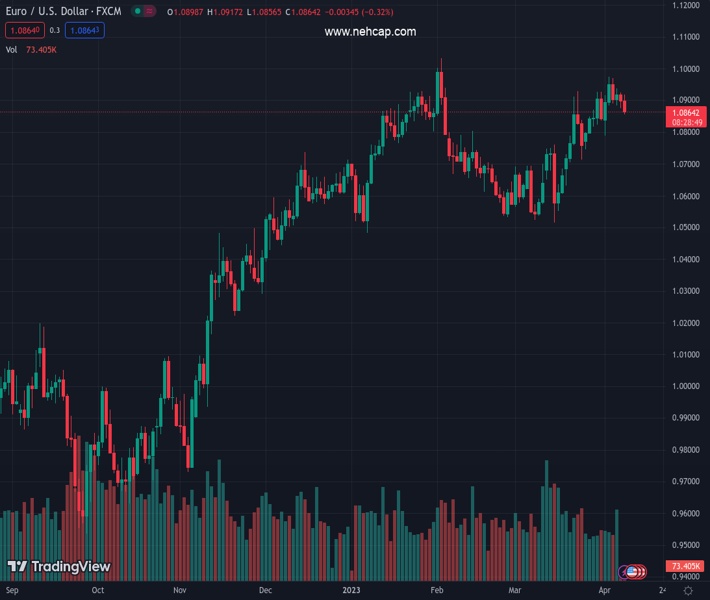
#EURUSD @ 1.08595 turns lower for the second successive day amid strong follow-through USD buying. (Pivot Orderbook analysis)
…
This is a premium post.
[s2If !current_user_can(access_s2member_level4)]Please register for PREMIUM VERSION HERE to read full post below containing analysis. In case of any error or you think you are not able to read the full post below, please email us at support#nehcap.com [lwa][/s2If] [s2If current_user_can(access_s2member_level4)]
- EUR/USD turns lower for the second successive day amid strong follow-through USD buying.
- Reviving bets for more rate hikes by the Fed and geopolitical tensions benefit the Greenback.
- The fundamental backdrop, however, warrants caution before placing aggressive bearish bets.
The pair currently trades last at 1.08595.
The previous day high was 1.0924 while the previous day low was 1.0876. The daily 38.2% Fib levels comes at 1.0895, expected to provide resistance. Similarly, the daily 61.8% fib level is at 1.0906, expected to provide resistance.
The EUR/USD pair attracts fresh sellers following an early uptick to the 1.0915 region and turns lower for the second successive day on Monday. This also marks the third day of a negative move in the previous four and drags spot prices to a one-week low, around the 1.0860-1.0855 region heading into the North American session.
A combination of supporting factors assists the US Dollar (USD) to gain strong follow-through traction on the first day of a new week, which, in turn, exerts downward pressure on the EUR/USD pair. In fact, the USD Index, which tracks the Greenback against a basket of currencies, spikes to a one-week high amid reviving bets for further policy tightening by the Federal Reserve (Fed). In fact, the markets are now pricing in a greater chance of a 25 bps lift-off at the next FOMC meeting in May and the bets were lifted by the mostly upbeat US employment details released on Friday. Apart from this, heightened US-China tensions over Taiwan and a generally weaker tone around the equity markets further lend support to the safe-haven buck.
Investors, however, seem convinced that the US central bank will cut rates in the second half of the year amid signs of slowing economic growth. This, along with the flight to safety, triggers a fresh leg down in the US Treasury bond yields and might hold back the USD bulls from placing aggressive bets. Furthermore, the growing acceptance of additional rate hikes by the European Central Bank (ECB) should continue to underpin the shared currency and limit the downside for the EUR/USD pair amid relatively light trading volumes. This warrants some caution before placing aggressive directional bets and positioning for an extension of the pair’s recent pullback from over a two-month top, around the 1.0970-1.0975 area touched last week.
Traders might also prefer to move to the sidelines ahead of the release of the latest US consumer inflation figures and the FOMC monetary policy meeting minutes on Wednesday. This week’s US economic docket also features the release of monthly Retail Sales figures, which will play a key role in influencing the near-term USD price dynamics and help determine the next leg of a directional move for the EUR/USD pair.
Technical Levels: Supports and Resistances
EURUSD currently trading at 1.0869 at the time of writing. Pair opened at 1.0904 and is trading with a change of -0.32 % .
| Overview | Overview.1 | |
|---|---|---|
| 0 | Today last price | 1.0869 |
| 1 | Today Daily Change | -0.0035 |
| 2 | Today Daily Change % | -0.3200 |
| 3 | Today daily open | 1.0904 |
The pair remains strongly bullish on the daily timeframe. It trades above its 20 SMA @ 1.0803, 50 SMA 1.0735, 100 SMA @ 1.0679 and 200 SMA @ 1.0352.
| Trends | Trends.1 | |
|---|---|---|
| 0 | Daily SMA20 | 1.0803 |
| 1 | Daily SMA50 | 1.0735 |
| 2 | Daily SMA100 | 1.0679 |
| 3 | Daily SMA200 | 1.0352 |
The previous day high was 1.0924 while the previous day low was 1.0876. The daily 38.2% Fib levels comes at 1.0895, expected to provide resistance. Similarly, the daily 61.8% fib level is at 1.0906, expected to provide resistance.
Note the levels of interest below:
- Pivot support is noted at 1.0879, 1.0854, 1.0831
- Pivot resistance is noted at 1.0927, 1.0949, 1.0975
| Levels | Levels.1 |
|---|---|
| Previous Daily High | 1.0924 |
| Previous Daily Low | 1.0876 |
| Previous Weekly High | 1.0973 |
| Previous Weekly Low | 1.0788 |
| Previous Monthly High | 1.0930 |
| Previous Monthly Low | 1.0516 |
| Daily Fibonacci 38.2% | 1.0895 |
| Daily Fibonacci 61.8% | 1.0906 |
| Daily Pivot Point S1 | 1.0879 |
| Daily Pivot Point S2 | 1.0854 |
| Daily Pivot Point S3 | 1.0831 |
| Daily Pivot Point R1 | 1.0927 |
| Daily Pivot Point R2 | 1.0949 |
| Daily Pivot Point R3 | 1.0975 |
[/s2If]
Join Our Telegram Group
")


