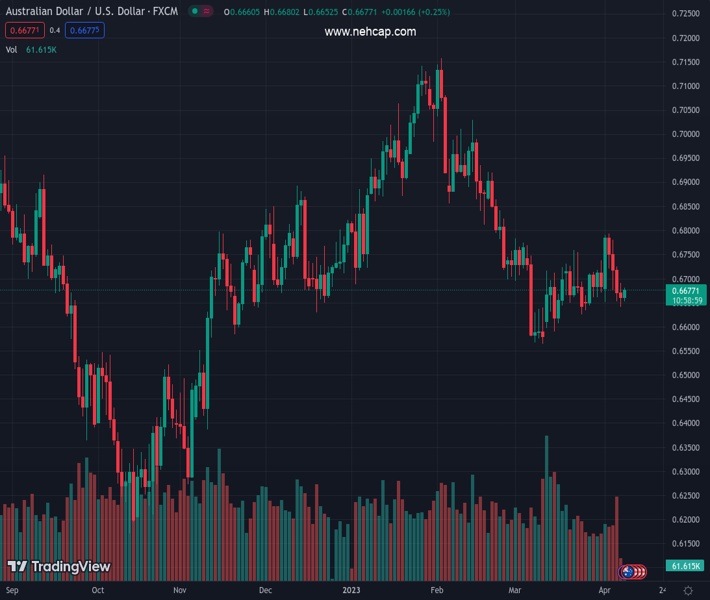
#AUDUSD @ 0.66756 edges higher on Monday and snaps a four-day losing streak to a two-week low. (Pivot Orderbook analysis)
…
This is a premium post.
[s2If !current_user_can(access_s2member_level4)]Please register for PREMIUM VERSION HERE to read full post below containing analysis. In case of any error or you think you are not able to read the full post below, please email us at support#nehcap.com [lwa][/s2If] [s2If current_user_can(access_s2member_level4)]
- AUD/USD edges higher on Monday and snaps a four-day losing streak to a two-week low.
- Expectations for a dovish Fed pivot keep the USD bulls on the defensive and lend support.
- Geopolitical tensions and the RBA’s dovish tilt might keep a lid on any meaningful upside.
The pair currently trades last at 0.66756.
The previous day high was 0.6691 while the previous day low was 0.6641. The daily 38.2% Fib levels comes at 0.6672, expected to provide support. Similarly, the daily 61.8% fib level is at 0.666, expected to provide support.
The AUD/USD pair attracts some buyers near the mid-0.6600s on the first day of a new week and moves away from a two-week low touched on Friday. Spot prices, however, lack follow-through and trade with a mild positive bias, around the 0.6675-0.6680 area during the first half of the European session.
The US Dollar (USD) struggles to preserve its modest intraday gains amid the uncertainty over the Federal Reserve’s (Fed) rate-hike path and turns out to be a key factor lending some support to the AUD/USD pair. The mostly upbeat US NFP released on Friday revived bets for another 25 bps lift-off at the next FOMC meeting in May. Market participants, however, seem convinced that the Fed will cut rates in the second half of the year amid signs of slowing economic growth. This is reinforced by a fresh leg down in the US Treasury bond yields, which acts as a headwind for the Greenback.
The upside for the AUD/USD pair, however, seems capped amid the Reserve Bank of Australia’s (RBA) dovish tilt last week, pausing its rate-hiking cycle following 10 consecutive raises and signalling that inflation had likely peaked. Apart from this, heightened US-China tensions over Taiwan might further contribute to keeping a lid on the risk-sensitive Aussie. This, in turn, makes it prudent to wait for strong follow-through buying before placing fresh bullish bets around the major confirming that the recent rejection slide from 100-day Simple Moving Average (SMA) has run its course.
Traders also seem reluctant and prefer to move to the sidelines ahead of the FOMC meeting minutes, due on Wednesday. This week’s US economic docket also features the release of the latest consumer inflation figures and monthly retail sales data. This will play a key role in influencing the USD price dynamics and provide a fresh directional impetus to the AUD/USD pair. Nevertheless, the fundamental backdrop suggests that the path of least resistance for spot prices remains to the downside and any further move up might still be seen as an opportunity for bearish traders.
Technical Levels: Supports and Resistances
AUDUSD currently trading at 0.6679 at the time of writing. Pair opened at 0.6674 and is trading with a change of 0.07 % .
| Overview | Overview.1 | |
|---|---|---|
| 0 | Today last price | 0.6679 |
| 1 | Today Daily Change | 0.0005 |
| 2 | Today Daily Change % | 0.0700 |
| 3 | Today daily open | 0.6674 |
The pair remains strongly bearish on the daily time frame. It trades below the 20 SMA @ 0.6688, 50 SMA 0.6784, 100 SMA @ 0.68 and 200 SMA @ 0.6748.
| Trends | Trends.1 | |
|---|---|---|
| 0 | Daily SMA20 | 0.6688 |
| 1 | Daily SMA50 | 0.6784 |
| 2 | Daily SMA100 | 0.6800 |
| 3 | Daily SMA200 | 0.6748 |
The previous day high was 0.6691 while the previous day low was 0.6641. The daily 38.2% Fib levels comes at 0.6672, expected to provide support. Similarly, the daily 61.8% fib level is at 0.666, expected to provide support.
Note the levels of interest below:
- Pivot support is noted at 0.6646, 0.6618, 0.6596
- Pivot resistance is noted at 0.6696, 0.6719, 0.6746
| Levels | Levels.1 |
|---|---|
| Previous Daily High | 0.6691 |
| Previous Daily Low | 0.6641 |
| Previous Weekly High | 0.6793 |
| Previous Weekly Low | 0.6641 |
| Previous Monthly High | 0.6784 |
| Previous Monthly Low | 0.6564 |
| Daily Fibonacci 38.2% | 0.6672 |
| Daily Fibonacci 61.8% | 0.6660 |
| Daily Pivot Point S1 | 0.6646 |
| Daily Pivot Point S2 | 0.6618 |
| Daily Pivot Point S3 | 0.6596 |
| Daily Pivot Point R1 | 0.6696 |
| Daily Pivot Point R2 | 0.6719 |
| Daily Pivot Point R3 | 0.6746 |
[/s2If]
Join Our Telegram Group
")


