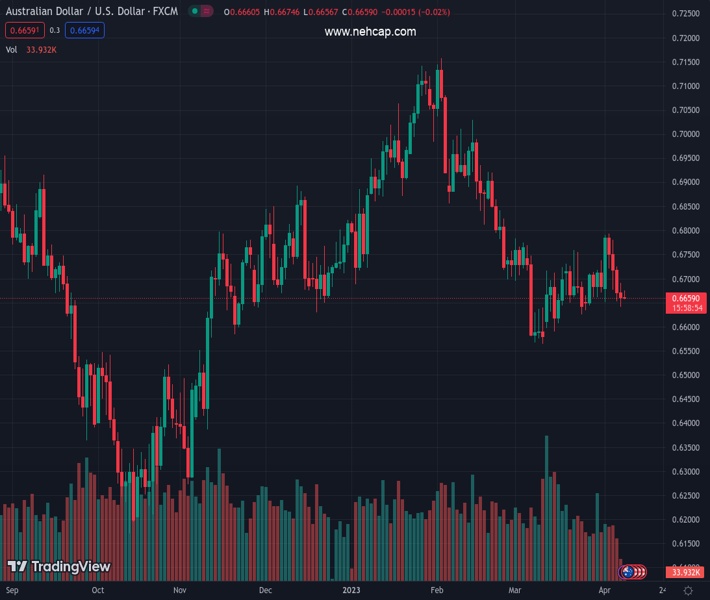
#AUDUSD @ 0.66589 remains sidelined around intraday low amid Easter Monday holiday. (Pivot Orderbook analysis)
…
This is a premium post.
[s2If !current_user_can(access_s2member_level4)]Please register for PREMIUM VERSION HERE to read full post below containing analysis. In case of any error or you think you are not able to read the full post below, please email us at support#nehcap.com [lwa][/s2If] [s2If current_user_can(access_s2member_level4)]
- AUD/USD remains sidelined around intraday low amid Easter Monday holiday.
- China’s military drills around Taiwan propelled geopolitical woes early in Asia.
- Absence of escalation in military strikes, off in multiple markets tame Aussie pair’s moves.
- Cautious mood before Aussie employment, US inflation, Fed Minutes weigh on AUD/USD but more clues needed for clear directions.
The pair currently trades last at 0.66589.
The previous day high was 0.6691 while the previous day low was 0.6641. The daily 38.2% Fib levels comes at 0.6672, expected to provide resistance. Similarly, the daily 61.8% fib level is at 0.666, expected to provide resistance.
AUD/USD sticks to minor losses around 0.6670, despite recently bouncing off the intraday low, as bears lack influencers amid the Easter Monday holiday. In doing so, the Aussie pair fails to justify the escalating geopolitical tension between the US and China.
China’s retaliation to Taiwan President Tsai Ing-wen’s US visit, by holding aggressive military drills near Taiwan Strait, triggered a risk-off mood during early Monday. However, the US refrains from speaking much as Reuters reports that the de facto US embassy in Taiwan said on Sunday the United States was monitoring China’s drills around Taiwan closely and is ‘comfortable and confident’ it has sufficient resources and capabilities regionally to ensure peace and stability. Apart from that, there is total silence from the US on this matter and hence the risk aversion seems cooling down of late, which in turn prods AUD/USD bears.
Even so, the Reserve Bank of Australia’s (RBA) pause on its rate hike trajectory joins downbeat Aussie inflation and Retail Sales data to keep AUD/USD sellers hopeful. On the same line could be the recently firmer US Nonfarm Payrolls (NFP) that allowed the Fed hawks to renew bets on the US central bank’s May-month rate hike.
As per the latest data from the US Bureau of Labor Statistics (BLS), the Nonfarm Payrolls (NFP) rose by 236K in March, the lowest since January 2021 (considering the revisions), versus 240K expected and 326K prior. Further, the Unemployment Rate eased to 3.5% versus 3.6% prior while the Labor Force Participation Rate improved to 62.6% from 62.5%. Finally, annual wage inflation, per the Average Hourly Earnings, dropped to 4.2% from 4.6%, versus market forecasts of 4.3%.
It should be noted that the escalating chatters surrounding the global recession jostles with China’s belief to anchor the macro waves with its ultra-easy monetary policy and fiscal efforts seem to test the AUD/USD pair traders.
Moving on, AUD/USD traders should pay attention to Australian employment numbers for clear directions. However, the US Consumer Price Index (CPI) data and the latest Federal Open Market Committee (FOMC) Monetary Policy Meeting Minutes will be more important for clear directions. Should the US inflation remains firmer and the Fed Minutes keep defending hawkish policy moves, the odds of witnessing the Aussie pair’s further downside can’t be ruled out.
A clear downside break of the one-month-old ascending support line, now immediate resistance around 0.6690, keeps AUD/USD bears hopeful. However, Friday’s Doji candlestick challenges the Aussie pair sellers unless the quote trades below the previous day’s low of 0.6641.
Technical Levels: Supports and Resistances
AUDUSD currently trading at 0.6663 at the time of writing. Pair opened at 0.6674 and is trading with a change of -0.16% % .
| Overview | Overview.1 | |
|---|---|---|
| 0 | Today last price | 0.6663 |
| 1 | Today Daily Change | -0.0011 |
| 2 | Today Daily Change % | -0.16% |
| 3 | Today daily open | 0.6674 |
The pair remains strongly bearish on the daily time frame. It trades below the 20 SMA @ 0.6688, 50 SMA 0.6784, 100 SMA @ 0.68 and 200 SMA @ 0.6748.
| Trends | Trends.1 | |
|---|---|---|
| 0 | Daily SMA20 | 0.6688 |
| 1 | Daily SMA50 | 0.6784 |
| 2 | Daily SMA100 | 0.6800 |
| 3 | Daily SMA200 | 0.6748 |
The previous day high was 0.6691 while the previous day low was 0.6641. The daily 38.2% Fib levels comes at 0.6672, expected to provide resistance. Similarly, the daily 61.8% fib level is at 0.666, expected to provide resistance.
Note the levels of interest below:
- Pivot support is noted at 0.6646, 0.6618, 0.6596
- Pivot resistance is noted at 0.6696, 0.6719, 0.6746
| Levels | Levels.1 |
|---|---|
| Previous Daily High | 0.6691 |
| Previous Daily Low | 0.6641 |
| Previous Weekly High | 0.6793 |
| Previous Weekly Low | 0.6641 |
| Previous Monthly High | 0.6784 |
| Previous Monthly Low | 0.6564 |
| Daily Fibonacci 38.2% | 0.6672 |
| Daily Fibonacci 61.8% | 0.6660 |
| Daily Pivot Point S1 | 0.6646 |
| Daily Pivot Point S2 | 0.6618 |
| Daily Pivot Point S3 | 0.6596 |
| Daily Pivot Point R1 | 0.6696 |
| Daily Pivot Point R2 | 0.6719 |
| Daily Pivot Point R3 | 0.6746 |
[/s2If]
Join Our Telegram Group
")


