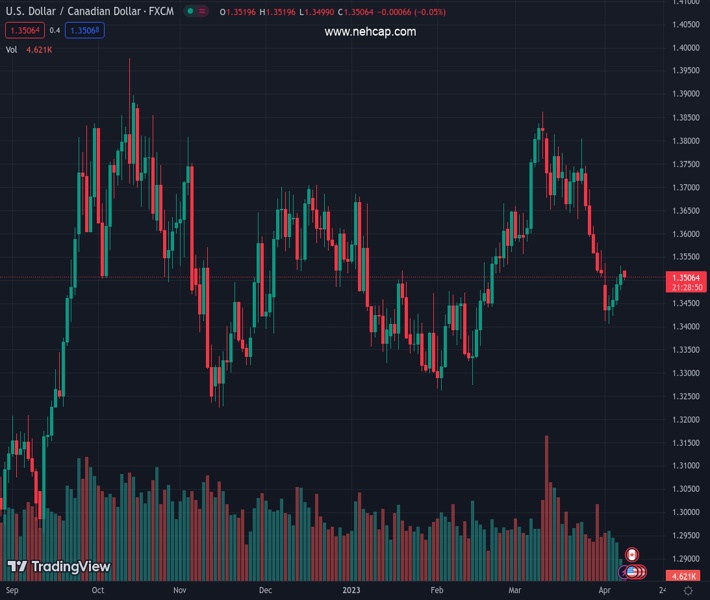
#USDCAD @ 1.35070 remains pressured around intraday low after snapping four-day uptrend on opening. (Pivot Orderbook analysis)
…
This is a premium post.
[s2If !current_user_can(access_s2member_level4)]Please register for PREMIUM VERSION HERE to read full post below containing analysis. In case of any error or you think you are not able to read the full post below, please email us at support#nehcap.com [lwa][/s2If] [s2If current_user_can(access_s2member_level4)]
- USD/CAD remains pressured around intraday low after snapping four-day uptrend on opening.
- China-Taiwan tension adds strength to the geopolitical fears and allow Oil price to remain firmer.
- BoC is likely to stand pat but concerns for future moves, mixed feelings for Fed prod Loonie pair buyers.
- US CPI, BoC Governor Macklem’s speech will also be important for clear directions.
The pair currently trades last at 1.35070.
The previous day high was 1.3531 while the previous day low was 1.3478. The daily 38.2% Fib levels comes at 1.3511, expected to provide resistance. Similarly, the daily 61.8% fib level is at 1.3498, expected to provide support.
USD/CAD holds lower ground near 1.3500, snapping a four-day winning streak, as traders brace for the key data/events amid the Easter Monday holidays in major bourses. That said, the Loonie pair’s latest weakness could be linked to the firmer price of Canada’s main export item, namely WTI crude oil. However, the dovish bias from the Bank of Canada (BoC), versus recently spiked hawkish Fed bets, challenge the pair sellers.
WTI crude oil prices print 0.61% intraday gains near $81.00, after rising in the last three consecutive weeks. The black gold’s latest gains could be linked to the geopolitical concerns surrounding China and Taiwan. Also fueling the energy benchmark is the OPEC+ supply cut and the softer US Dollar.
That said, the US Dollar Index (DXY) dropped in the last three weeks in a row, pressured around 102.00 at the latest.
The fears of higher Fed rates versus no action from the Bank of Canada (BoC) gained momentum after the upbeat US Jobs report, versus no major positives from the Canadian jobs report for March.
As a result, the CME’s FedWatch Tool suggests 69% odds of the 0.25% rate hike in May, versus 55% before the US jobs report.
Talking about the data, Canada’s headline Net Change in Employment rose to 34.7K in March from 21.8K prior, versus 12K market consensus, whereas the Unemployment Rate reprinted 5.0% figure compared to analysts’ estimate of 5.1%. It’s worth noting, however, that the Participation Rate eased to 65.6% during the stated month from 65.7% expected and prior. Further, the Average Hourly Wages eased to 5.2% YoY in March versus 5.4% previous reading.
On the other hand, the US Bureau of Labor Statistics (BLS) revealed that Nonfarm Payrolls (NFP) rose by 236K in March, the lowest since January 2021 (considering the revisions), versus 240K expected and 326K prior. Further, the Unemployment Rate eased to 3.5% versus 3.6% prior while the Labor Force Participation Rate improved to 62.6% from 62.5%. Finally, annual wage inflation, per the Average Hourly Earnings, dropped to 4.2% from 4.6%, versus market forecasts of 4.3%.
Amid these plays, US stock futures closed positive but the yields remain pressured ahead of the key BoC monetary policy meeting, US inflation and the Fed Minutes. Given the dovish concerns from the BoC and likely hawkish comments in the FOMC Minutes, the USD/CAD may witness further upside unless witnessing any surprises.
USD/CAD portrays another failure to cross the 100-DMA, around 1.3530 by the press time, which in turn joins the bearish MACD signals and steady RSI to tease the Loonie pair sellers.
Technical Levels: Supports and Resistances
USDCAD currently trading at 1.3506 at the time of writing. Pair opened at 1.3516 and is trading with a change of -0.07% % .
| Overview | Overview.1 | |
|---|---|---|
| 0 | Today last price | 1.3506 |
| 1 | Today Daily Change | -0.0010 |
| 2 | Today Daily Change % | -0.07% |
| 3 | Today daily open | 1.3516 |
The pair is trading below its 20 Daily moving average @ 1.3621, below its 50 Daily moving average @ 1.3555 , below its 100 Daily moving average @ 1.3529 and above its 200 Daily moving average @ 1.339
| Trends | Trends.1 | |
|---|---|---|
| 0 | Daily SMA20 | 1.3621 |
| 1 | Daily SMA50 | 1.3555 |
| 2 | Daily SMA100 | 1.3529 |
| 3 | Daily SMA200 | 1.3390 |
The previous day high was 1.3531 while the previous day low was 1.3478. The daily 38.2% Fib levels comes at 1.3511, expected to provide resistance. Similarly, the daily 61.8% fib level is at 1.3498, expected to provide support.
Note the levels of interest below:
- Pivot support is noted at 1.3486, 1.3456, 1.3433
- Pivot resistance is noted at 1.3539, 1.3561, 1.3592
| Levels | Levels.1 |
|---|---|
| Previous Daily High | 1.3531 |
| Previous Daily Low | 1.3478 |
| Previous Weekly High | 1.3537 |
| Previous Weekly Low | 1.3406 |
| Previous Monthly High | 1.3862 |
| Previous Monthly Low | 1.3508 |
| Daily Fibonacci 38.2% | 1.3511 |
| Daily Fibonacci 61.8% | 1.3498 |
| Daily Pivot Point S1 | 1.3486 |
| Daily Pivot Point S2 | 1.3456 |
| Daily Pivot Point S3 | 1.3433 |
| Daily Pivot Point R1 | 1.3539 |
| Daily Pivot Point R2 | 1.3561 |
| Daily Pivot Point R3 | 1.3592 |
[/s2If]
Join Our Telegram Group
")


